Verified AI summary ◀▼
Learn how to manage your active forecasts to predict contact volumes and staffing needs. View and organize workstreams, recalculate forecasts to adjust for demand changes, and export data for analysis. This feature helps you optimize resource allocation and meet service goals by analyzing historical data and applying advanced algorithms.
Forecasting in Zendesk Workforce Management (WFM) predicts future contact volumes and staffing needs by analyzing historical data and applying advanced algorithms. This process ensures that the right number of agents are scheduled at the right times, helping you optimize resources and consistently meet service goals.
In this article, you'll learn how to view and understand your active WFM forecasting per workstream. You can edit your forecast settings by recalculating the forecast and organizing your workstreams. You can also export forecast data.
This article contains the following topics:
Related articles:
Viewing and organizing workstreams
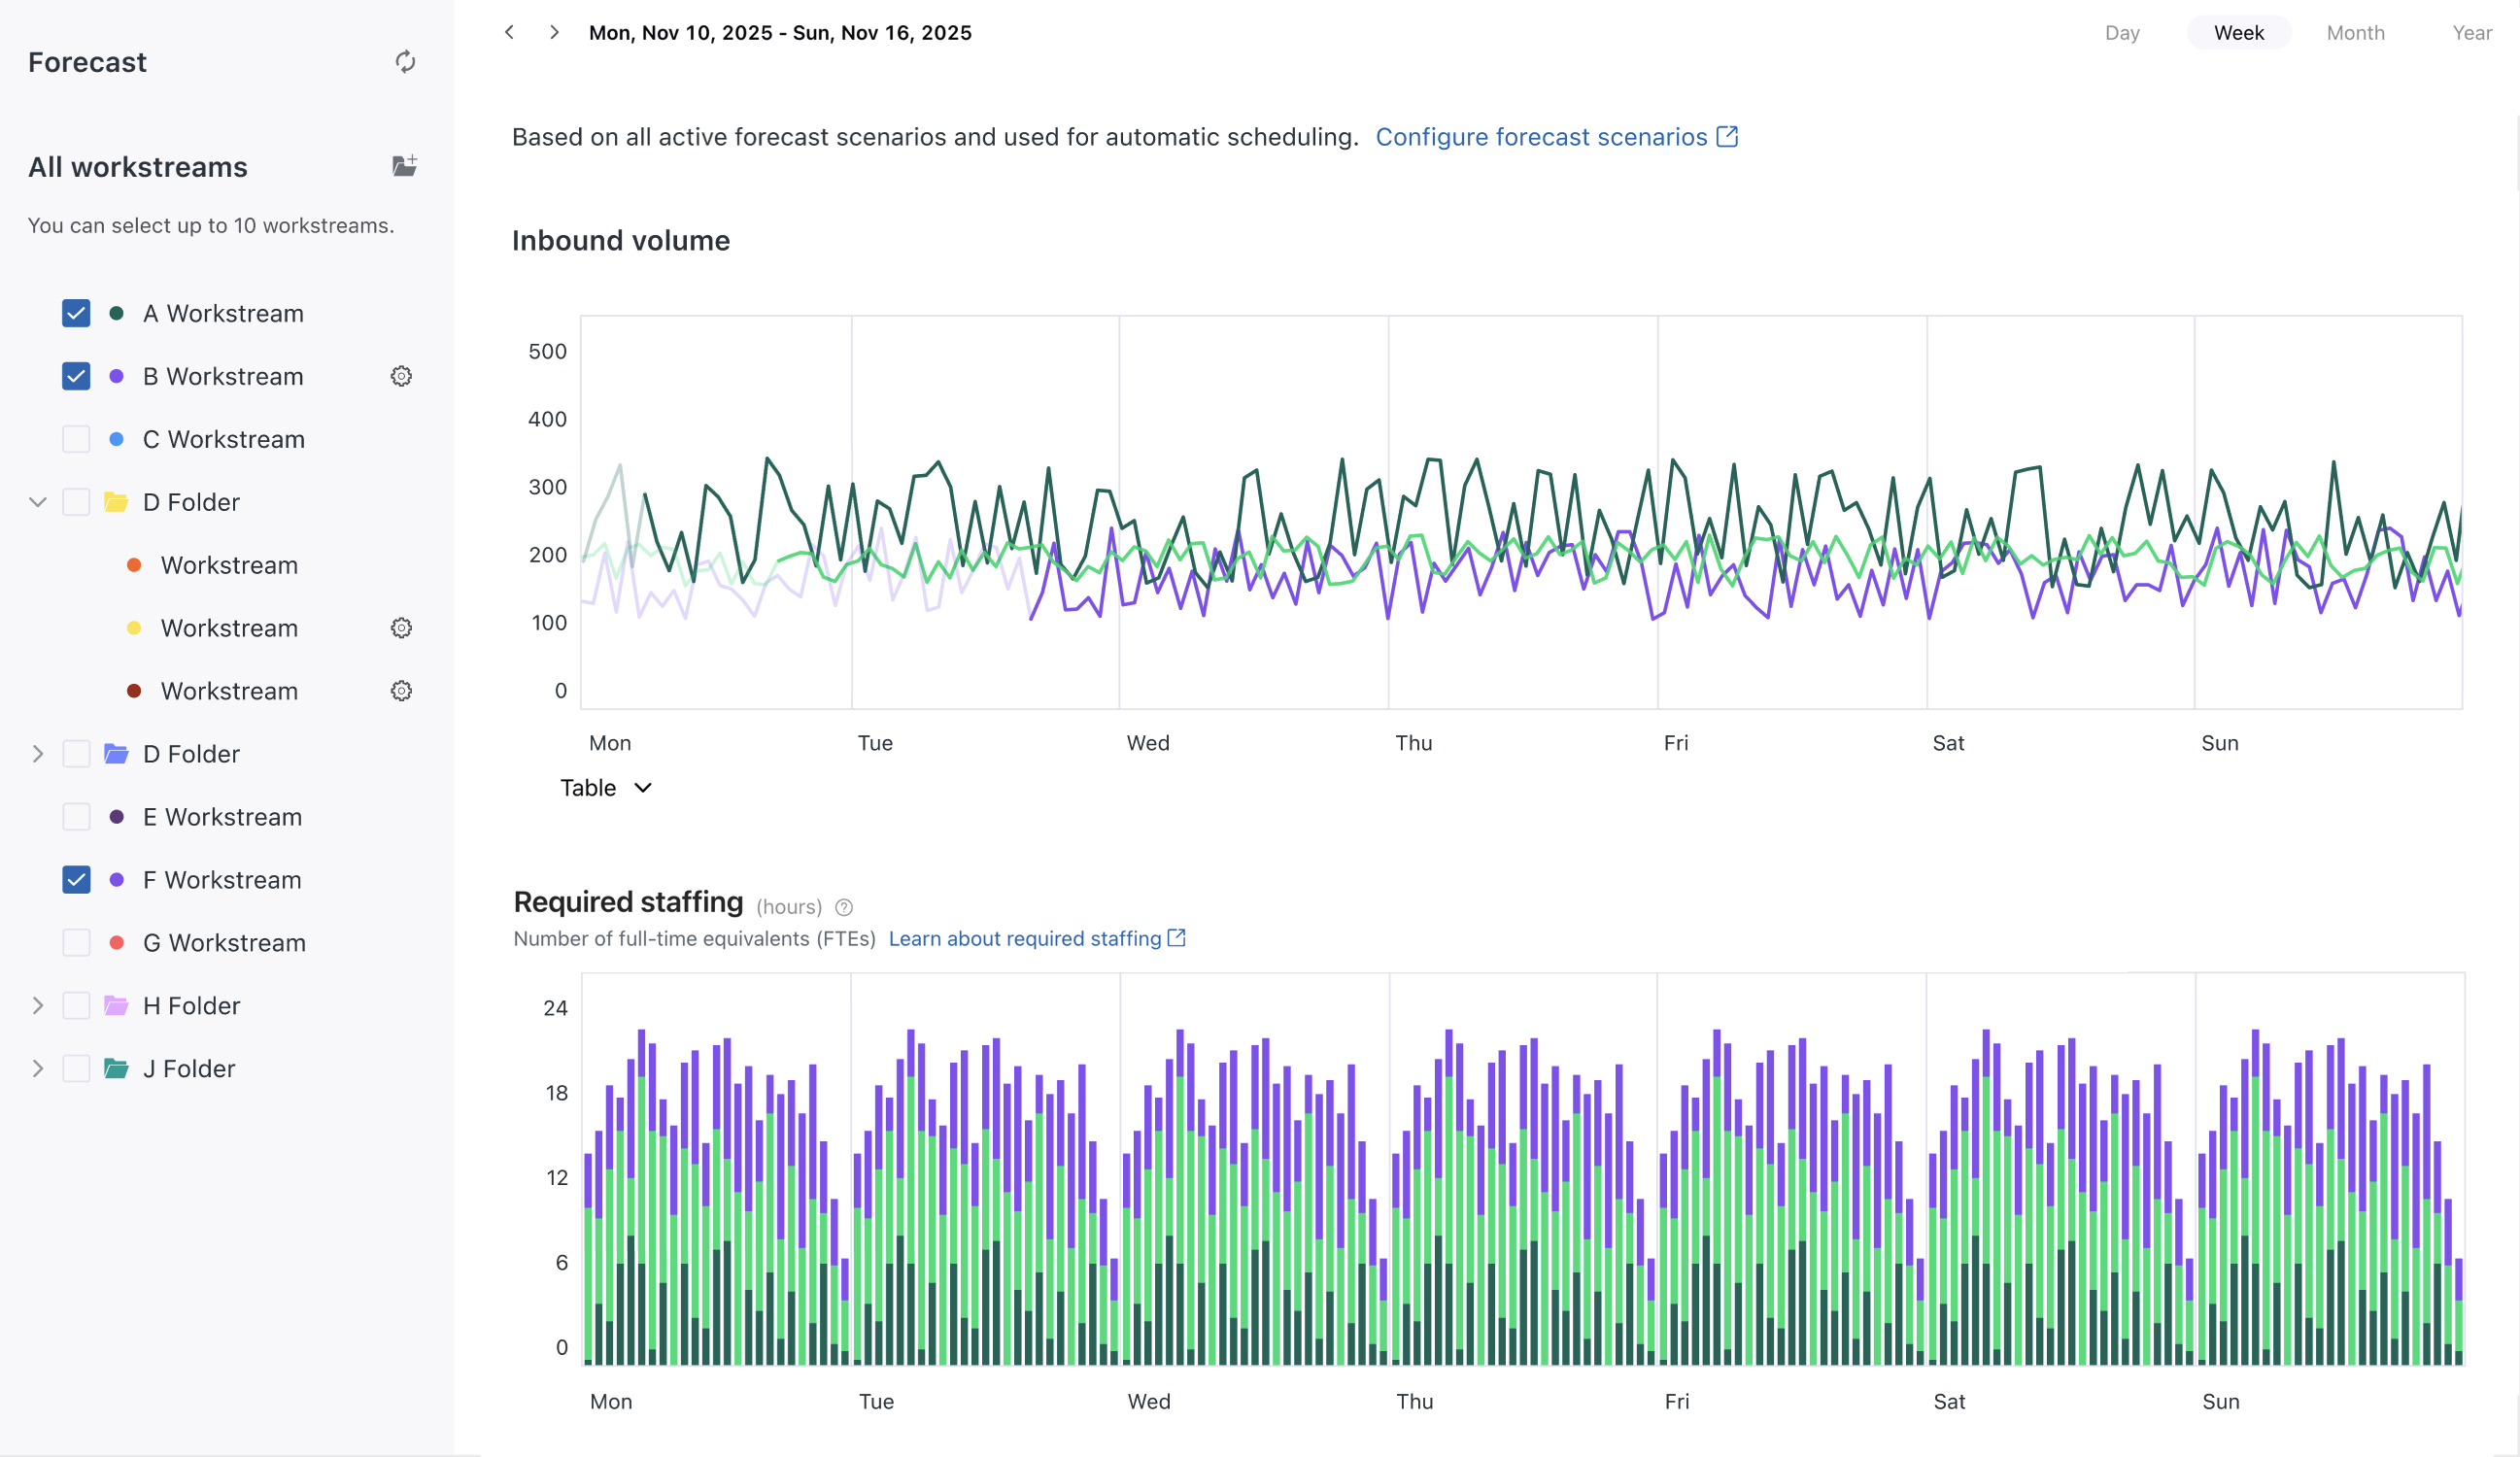
You can view active forecasts for up to 10 workstreams at a time. Each workstream is represented by a color.
You can also organize your workstreams on the Active forecast page. To create additional workstreams or modify existing ones, see Creating workstreams.
You must be a WFM admin or have permission to access the Active forecast page.
To view and organize your workstreams in the Active forecast page
-
In Workforce management, click
 Forecasting in the navigation bar, then select Active forecast.
Take any of the following actions:
- Show or hide workstream trend charts by selecting them. At any given time,
only 10 or fewer workstreams can be visible on a chart.
When a selected forecast is available, it's displayed under Inbound volume.
Based on the forecast, Zendesk WFM also calculates the staff count needed to handle the expected workload under Required staffing. - Use the buttons in the top right to select daily, weekly, monthly, or yearly views.
- Use the arrow icons (
 ) in the top left to navigate back and forth in
time.
) in the top left to navigate back and forth in
time. - Click Table under the chart view for Inbound volume or Required staffing to expand their table views.
- Edit the workstream by clicking the options menu (
 ) next to it and selecting Go to workstream
page. This takes you to that workstream page where you can make your
edits.
) next to it and selecting Go to workstream
page. This takes you to that workstream page where you can make your
edits. - Group your workstreams by clicking the folder icon (
 ) to create a new folder. Then, drag
your workstreams into the folder to see a combined forecast for multiple
workstreams.
) to create a new folder. Then, drag
your workstreams into the folder to see a combined forecast for multiple
workstreams. - Edit the folder by clicking the options menu () next to it and selecting Rename,
Change color, or Remove folder.
- Click the settings icon (
 ) to view information on recent
updates to this forecast.
) to view information on recent
updates to this forecast.
- Show or hide workstream trend charts by selecting them. At any given time,
only 10 or fewer workstreams can be visible on a chart.
Recalculating forecasts
Recalculate your forecast to adjust staffing estimates based on changing conditions, ensuring your team is prepared to handle fluctuations in demand.
You can recalculate your forecast for all or specific workstreams. All inbound volume calculations update with new historical volumes. Workstreams that have imported historical volumes do not recalculate.
To recalculate a forecast
- In Workforce management, click
Forecasting in the navigation bar, then select Active forecast.
- Click the options menu (
 ) next to the workstream you want to
recalculate.
) next to the workstream you want to
recalculate. - Click Recalculate forecast.
To recalculate all forecasts
You can request a full recalculation of the forecast for all your workstreams every five minutes.
- In Workforce management, click
Forecasting in the navigation bar, then select Active forecast.
- Click the recalculate icon
 next to Forecast.
Exporting forecast data
You can export your workstreams' inbound volume and staffing forecasts to CSV files.
Exporting forecast data provides valuable insights for analysis and reporting.
To export forecast data
- In Workforce management, click
Forecasting in the navigation bar, then select Active forecast.
- Select the workstreams for which you want to export forecast data.
- Click the CSV icon (
 ) in the bottom right corner under the table you want
to export.
) in the bottom right corner under the table you want
to export. The download starts.