Verified AI summary ◀▼
Learn how to set up workforce management forecasting to predict future contact volumes and staffing needs. Configure historical volume periods, choose forecasting algorithms, adjust for upcoming events, exclude outliers, and edit staffing parameters to optimize resource allocation and meet service goals. This setup helps ensure you have the right number of agents scheduled at the right times.
Forecasting in Zendesk Workforce management (WFM) is the process of predicting future contact volumes and staffing needs using historical data and advanced algorithms to ensure that the right number of agents are scheduled at the right times. This helps you optimize resources and consistently meet service goals.
In this article, you'll learn how to set up and manage your WFM forecasting by setting the historical volume period for each of your workstreams forecast scenarios, selecting a forecasting algorithm, adjusting your expected volume based on unique upcoming events, excluding outliers to remove dates and times that may skew your forecast, and configuring your staffing parameters to calculate how many agents you should expect to schedule.
Related articles:
Setting the historical volume period
You can set the historical volume period for each workstream forecast scenario. This allows you to decide which historical data you want to include or exclude in your forecast calculation.
See Understanding WFM forecasting to learn more about how your historical Zendesk ticket data is migrated.
- In Workforce management, click
 Forecasting in the sidebar, then select Forecast scenarios.
 - Under Workstreams, use the drop-down menu to select a workstream.
- Click the scenario you want to view.
- In the Historical volume panel, select if you want to use your Zendesk
data or to use Imported data as your Data source.
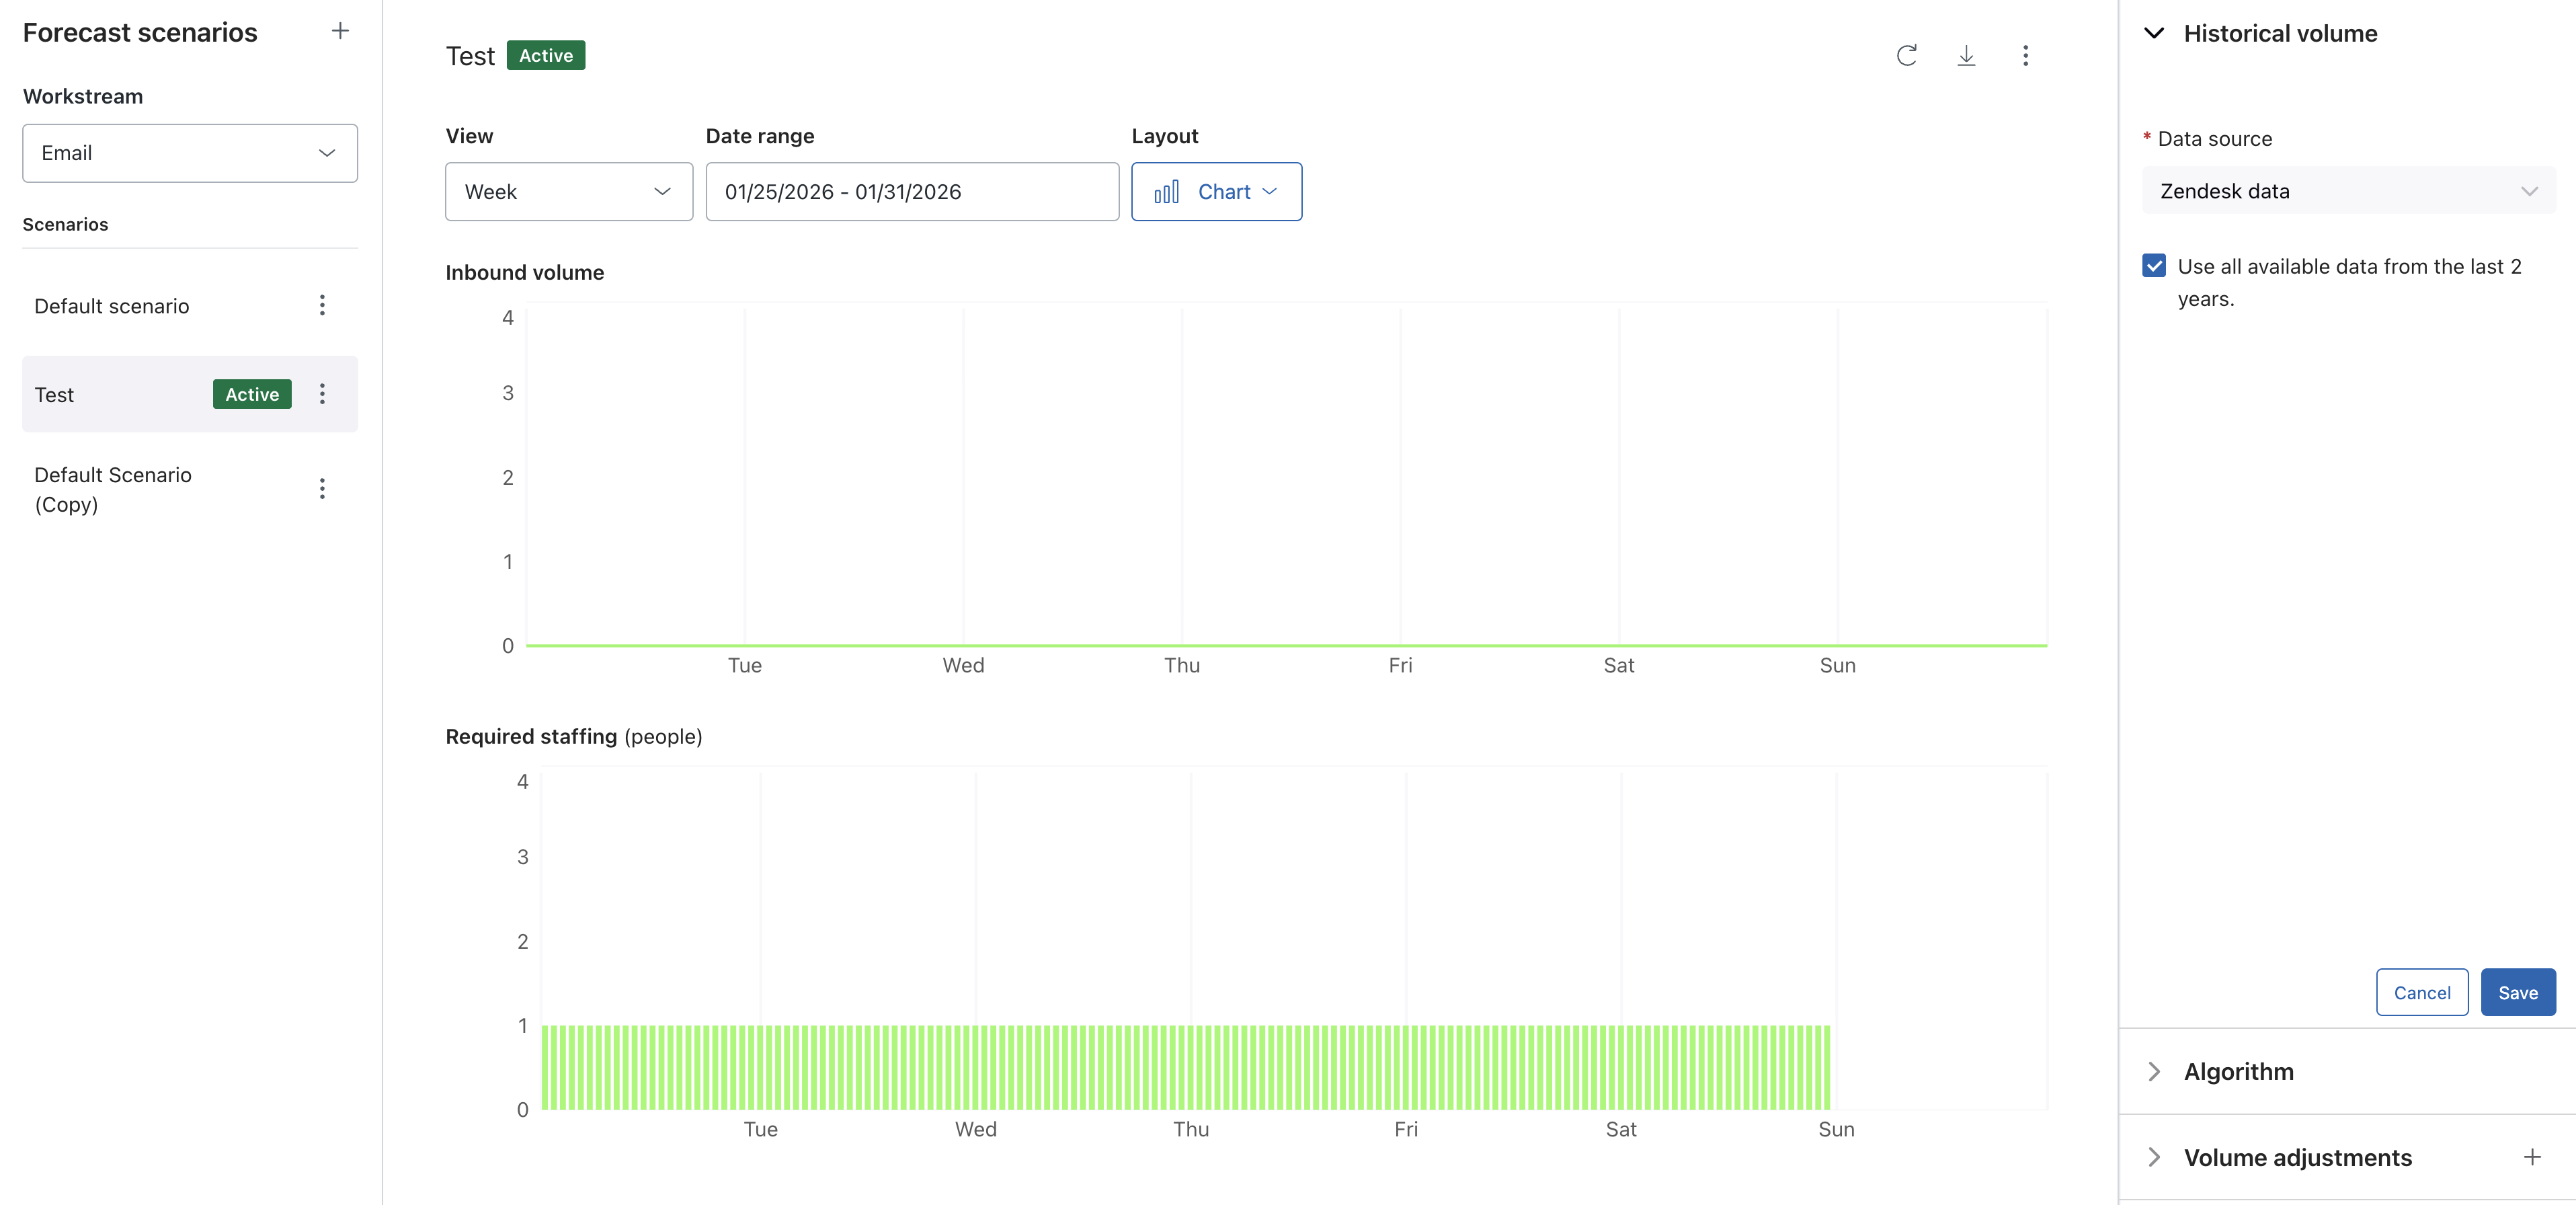
- If you selected Zendesk data, choose whether to Use all available data
from the last 2 years or to Ignore data prior to a specific date. Use
the date picker to select your desired date.Important: The forecasting engine can use up to two years of data if it's available within WFM. Keep in mind that only six months of your historical ticket data from Zendesk is migrated into WFM when it's first activated for your account. You must contact Zendesk Support to manually import a longer historical period.
- If you selected Imported data, download and use the Import volume template.
See Importing historical volume for WFM
forecasts.Tip: You can also forecast outbound volumes by importing outbound ticket data into a specific workstream.
- If you selected Zendesk data, choose whether to Use all available data
from the last 2 years or to Ignore data prior to a specific date. Use
the date picker to select your desired date.
- Click Save.
Selecting a forecasting algorithm
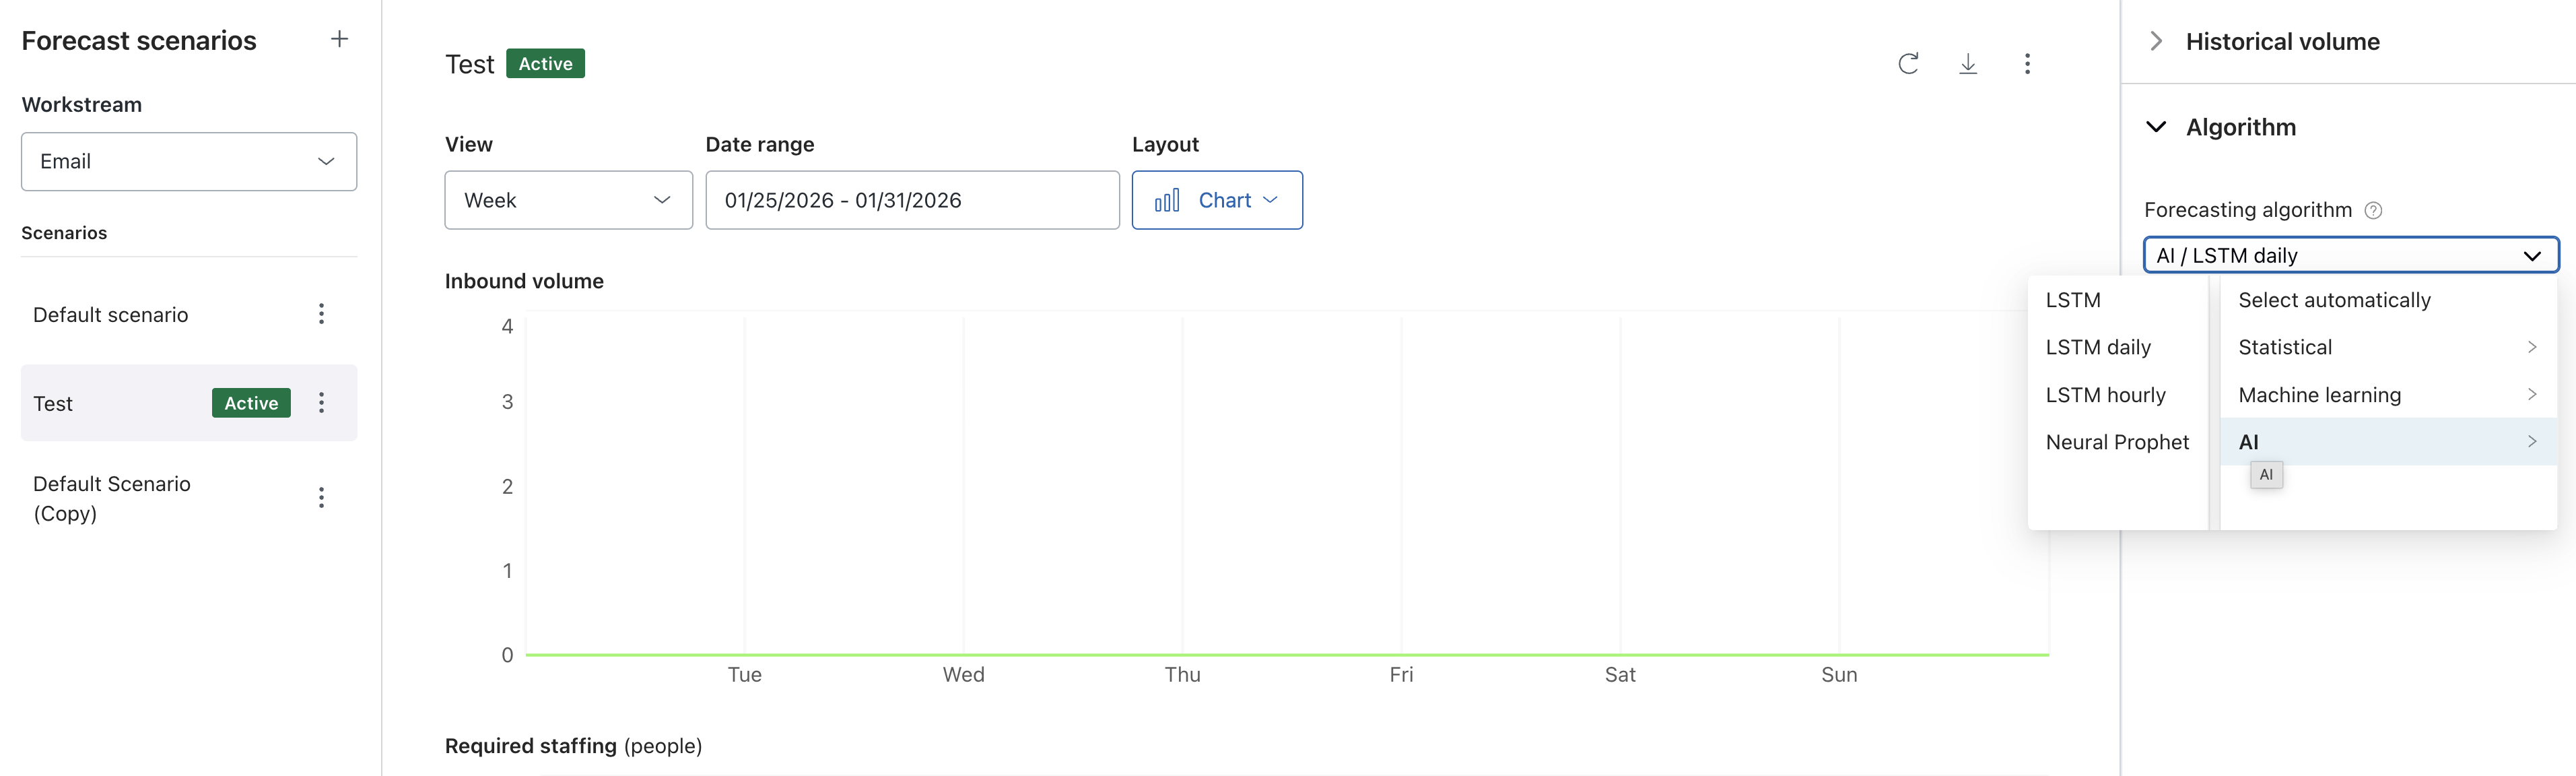
You can set the Forecasting algorithm for each workstream forecast scenario.
The best forecasting algorithm for each workstream is automatically selected by analyzing your historical data and testing all algorithms. This is to determine which will perform best for the specific workstream. However, you can overwrite the automatic algorithm selection and choose any algorithm Zendesk WFM offers. See About WFM forecast algorithms to learn more.
- In Workforce management, click
Forecasting in the sidebar, then select Forecast scenarios.
- Under Workstreams, use the drop-down menu to select a workstream.
- Click the scenario you want to view.
- In the Algorithm panel on the right, select the algorithm you want to use as
Forecasting algorithm for this workstream.
- Click Save.
Adjusting the inbound volume
You can adjust the expected inbound volume based on unique upcoming events, such as marketing campaigns and feature sunsets for each workstream forecast scenario. See Understanding inbound volume.
To adjust your inbound volume
- In Workforce management, click
Forecasting in the sidebar, then select Forecast scenarios.
- Under Workstreams, use the drop-down menu to select a workstream.
- Click the scenario you want to view.
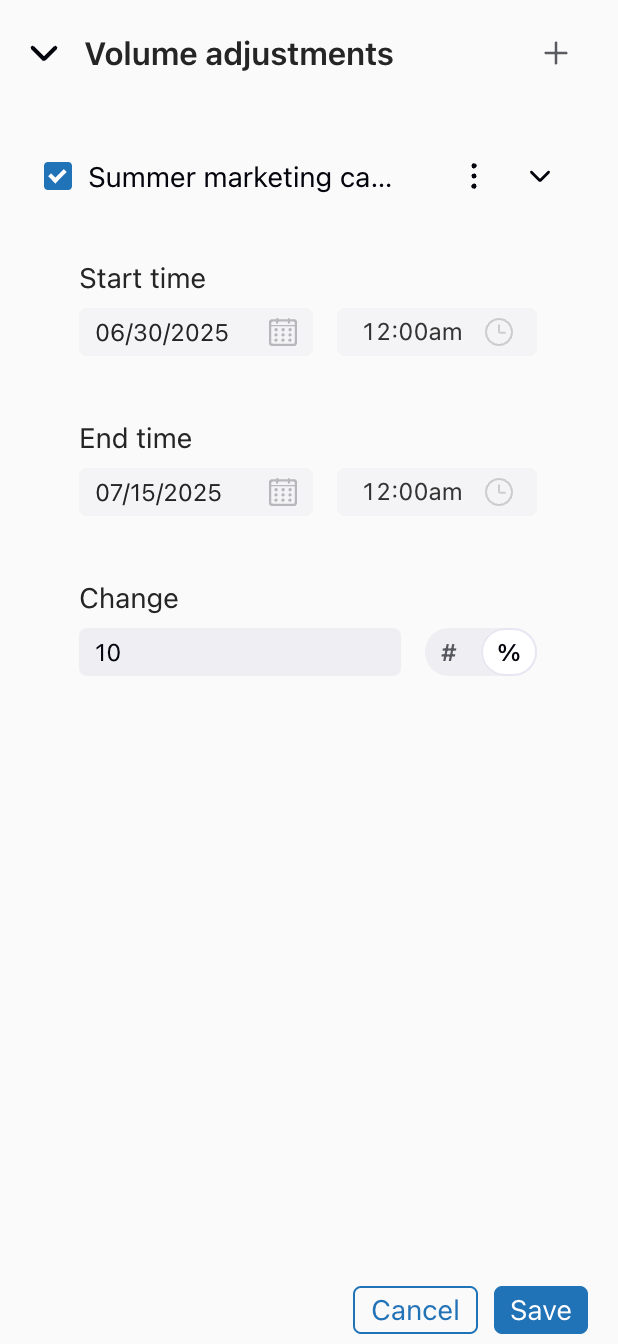
- In the Volume adjustments panel on the right, click the plus icon (+) to add an
adjustment.
Here, you can:
- Rename your adjustment to give it more context. For example, you can name it Marketing, New feature release, etc.
- Select the date range to apply your volume changes.
- Enter your expected inbound ticket volume under Change and select if this value is a percentage (%) or exact value (#).
- You can continue creating additional volume adjustments by clicking the plus icon (+).
- When you're done, click Save.
Your inbound volume chart and required staffing counts are updated.
Understanding inbound volume adjustment distribution
The distribution of your inbound ticket volume adjustment is calculated by rounding to one decimal place, for example, 10.1 instead of 10.123.
Values are distributed in 15-minute intervals proportionally to what the forecast calculates. Any remainders are then distributed randomly, following the patterns identified in the forecast.
The following examples illustrate different scenarios for this calculation.
Volume adjustment by number of tickets
Selecting changes by the number of tickets for a specific time period distributes them according to the forecasted trend for that period.
For example, if you expect 10 additional tickets on a future day and assume the forecast is equal throughout the day, the tickets are distributed evenly across all time intervals.
Each day consists of 96 15-minute intervals. Dividing the 10 additional tickets by 96 equals approximately 0.10416667.
This value is rounded to 0.1 and added to each 15-minute interval:
96 * 0.1 = 9.6 tickets, leaving 0.4 from the total of 10The remaining 0.4 tickets are distributed randomly according to the forecast pattern.
Volume adjustment by percentage
When you create an inbound volume adjusted by percentage, the algorithm takes the absolute value of tickets for the selected period and applies the percentage to it. This results in the addition or subtraction of a number of tickets, which is then distributed as described above.
For example, consider a one-day period with an expected value of 20 tickets. If you set an increase of 100% for that specific day, the expected number of tickets doubles to 40. The distribution process then occurs as explained above.
Excluding historical inbound volume outliers
You can exclude outliers by removing dates and times that may skew your forecast. This can be useful for events such as a one-time marketing campaign or an outage that could have caused a sudden increase in your inbound volume.
After you've saved the excluded outliers, the forecast recalculates and displays without the impact of historical spikes. It may take a few moments for the forecast to recalculate
To exclude historical inbound volume outliers
- In Workforce management, click
Forecasting in the sidebar, then select Forecast scenarios.
- Under Workstreams, use the drop-down menu to select a workstream.
- Click the scenario you want to view.
- In the Excluded Outliers panel on the right, click the plus icon (+) to add an outlier.
- Click in the name field or select the options menu icon (
 ), then select Rename.
Accurately rename the outlier. For example, Outage.
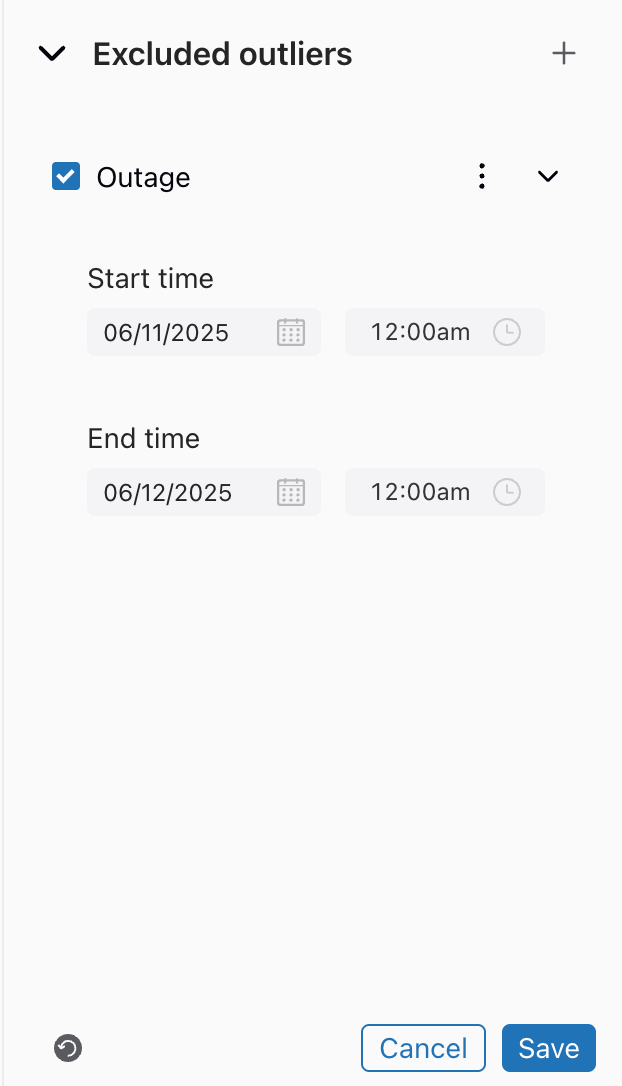
- Choose a start and end time and date as well as the time you want to exclude.If the selected exclusion date range does not have enough preceding data to remove the outlier (a minimum of two weeks is required), this specific outlier will not be replaced, and a warning will be displayed. However, the forecast will still be generated successfully.
- Click Save.
- (Optional) If you want to delete an excluded outlier, click the options menu icon
(), then select Delete. If you want to delete
all of the outliers created, click the button at the bottom of the column.
Editing staffing parameters
The forecast allows you to adjust full-time equivalent (FTE) count parameters according to your business needs, since not every workstream has the same first response time (FRT), average handle time (AHT) and shrinkage expectations.
Your minimum staffing number is respected whenever possible during automatic scheduling. However, there are cases where high forecasted demand takes priority over minimum staffing. If a workstream is part of a combined workstream, the minimum staffing number to respect is the highest across all workstreams involved. Learn more about Required staffing.
You can also set specific business hours and a channel preference for a workstream. The channel preference controls staffing parameters that will be used to build your staffing forecast.
To modify your FTE count parameters
- In Workforce management, click
Forecasting in the sidebar, then select Forecast scenarios.
- Under Workstreams, use the drop-down menu to select a workstream.
- Click the scenario you want to view.
- In the Staffing parameters panel on the right, click the arrow to expand the
panel. From here you can:
- Select the Channel preference for the workstream.
- Adjust the Occupancy Rate for the workstream.
- Change the AHT and select values for hh:mm:ss.
- Specify the Target of the FRT and select the values for hh:mm:ss.
- State the SLA attainment Target.
- Enter a Shrinkage value.
-
Note: Shrinkage is the % value of unscheduled or scheduled activities (vacations, sick leaves, etc.) which prevent employees from performing their work. The industry standard is approximately 15-35%.
- Add the minimum staffing number you need for that workstream.
- Choose whether or not you want to specify your availability or business hours.
- You can also reset to the default values.

- When you're done, click Save.