When you add live data components to your dashboards, they don't support multiple selections. For example, your report contains the Solved tickets live component, and you only want to show results for Group 1 and Group 2 ticket groups.
In this recipe, you'll learn how to use filtered views and dashboard tabs to examine live data for multiple groups on separate tabs within a dashboard.
For help creating dashboards containing live data and live data filters, see Adding live data and live filter components to dashboards.
This recipe contains the following sections:
What you'll need
Skill level: Intermediate
Time required: 15 minutes
- Zendesk Explore Enterprise
- Editor or Admin permissions (see Giving agents access to Explore)
- Ticket data to report on
- One live data component and one live data filter for each dashboard tab you want to add. For details about live data component limits, see Live data limits for dashboards.
- Two groups with at least one user in each, named Group 1 and Group 2
Creating the dashboard
In this section, you'll create a dashboard containing two tabs. Both tabs will show the live number of solved tickets.
The first tab, Tab 1, will show the current number of solved tickets for the Group 1 group. The second tab, Tab 2, will show the current number of solved tickets for the Group 2 group.
This enables your report viewers to report solved tickets for each group in the same dashboard without configuring any filters.
Creating the dashboard
Now, create the basic dashboard containing two tabs, one for each group.
To create the dashboard
- In Explore Enterprise, create or open a dashboard. For help, see Creating dashboards.
- With the dashboard in edit mode, click the + icon in the Tabs section. You'll now have a dashboard with two tabs.
- Hover over the first tab, click the options icon (
 ), then click Rename.
 - Enter "Tab 1" as the tab name, then click the tick icon.

- Rename the other dashboard tab as "Tab 2" using the same process.
- Click the pen icon next to the dashboard title (currently Untitled) and give it a name, for example, Live tickets by support group.
You'll now have a dashboard that looks like this:

Configuring the first tab
In this section, you'll set up the first dashboard tab. This tab displays live data for the number of solved tickets. It uses a live data filter and bookmark to show only Group 1 support group data by default.
To configure the first tab
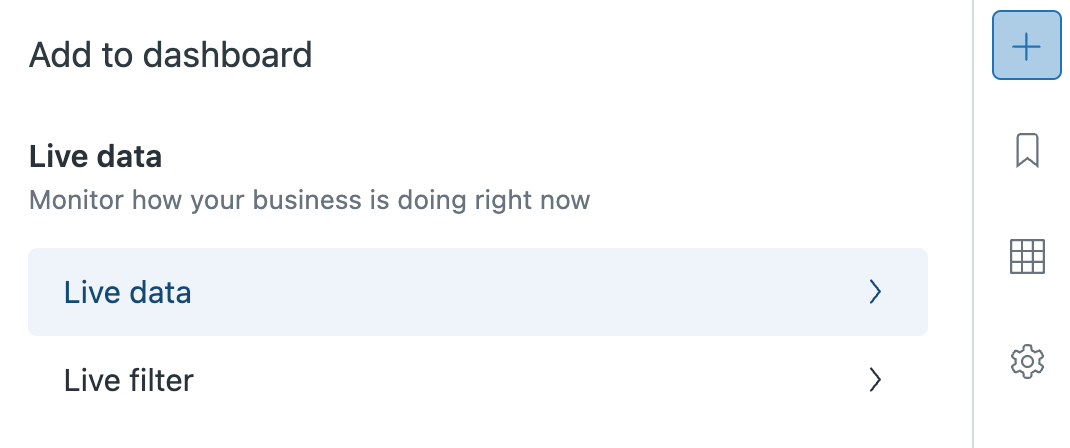
- With the dashboard in edit mode and Tab 1 selected, click the plus icon (+), then select Live data.
- From the Add live data list, select Support - Solved tickets. The report is added to your dashboard.
- Click the + icon again, then select Add live data filters.
- From the list of live data filters, choose Support - Tickets group, The filter is added to your dashboard.
- Rearrange the report and filter as you need. See Adding and arranging dashboard components.
- From the Support - Tickets group live data filter you just added, select Group 1. The live data report displays only solved tickets for Group 1.

- Next, configure a bookmark to ensure this dashboard tab always opens showing solved tickets from Group 1. Click the bookmark icon (
 ).
). - On the Create filtered view panel, give the bookmark a name like Filtered view 1, then check Set as default to ensure that the tab opens with the current settings.

Configuring the second tab
Now, you'll set up the second tab. The method to configure this tab is similar to setting up the first tab.
To configure the second tab
Follow the instructions in Configuring the first tab with the following changes:
-
- Before you start, click Tab 2.
- In the Support - Tickets group live data filter, choose Group 2.
- Name the bookmark Filtered view 2.
Now, the solved tickets are shown for Group 2 whenever you open the tab.
You've completed the recipe. Now, when you click Tab 1, you'll see results for Group 1, and when you open Tab 2, you'll see results for Group 2.