Question
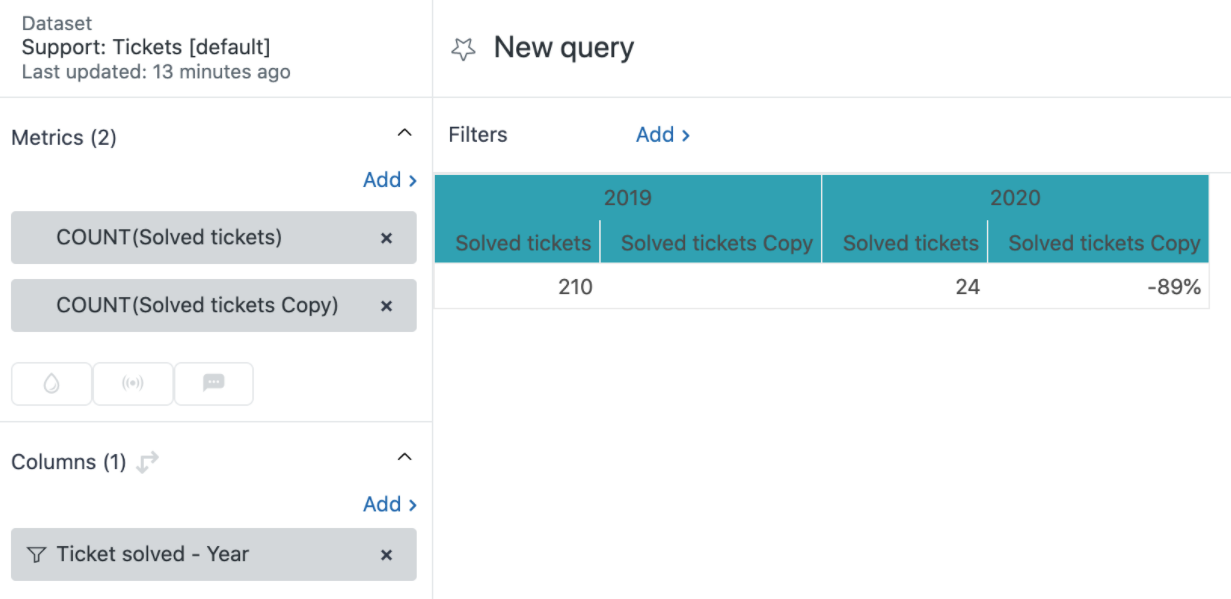
I created a result path calculation to show the evolution of Solved tickets in the past two years. When I finished, the report stopped showing the absolute values. I can only see the manipulated results in the image below. How can I add a column in the report that shows the absolute values alongside the manipulated results?

Answer
The result path calculation shows the evolution between two values and when it's used, it replaces the absolute value with the manipulated results.
This article explains how to work around this behavior and display the original values.
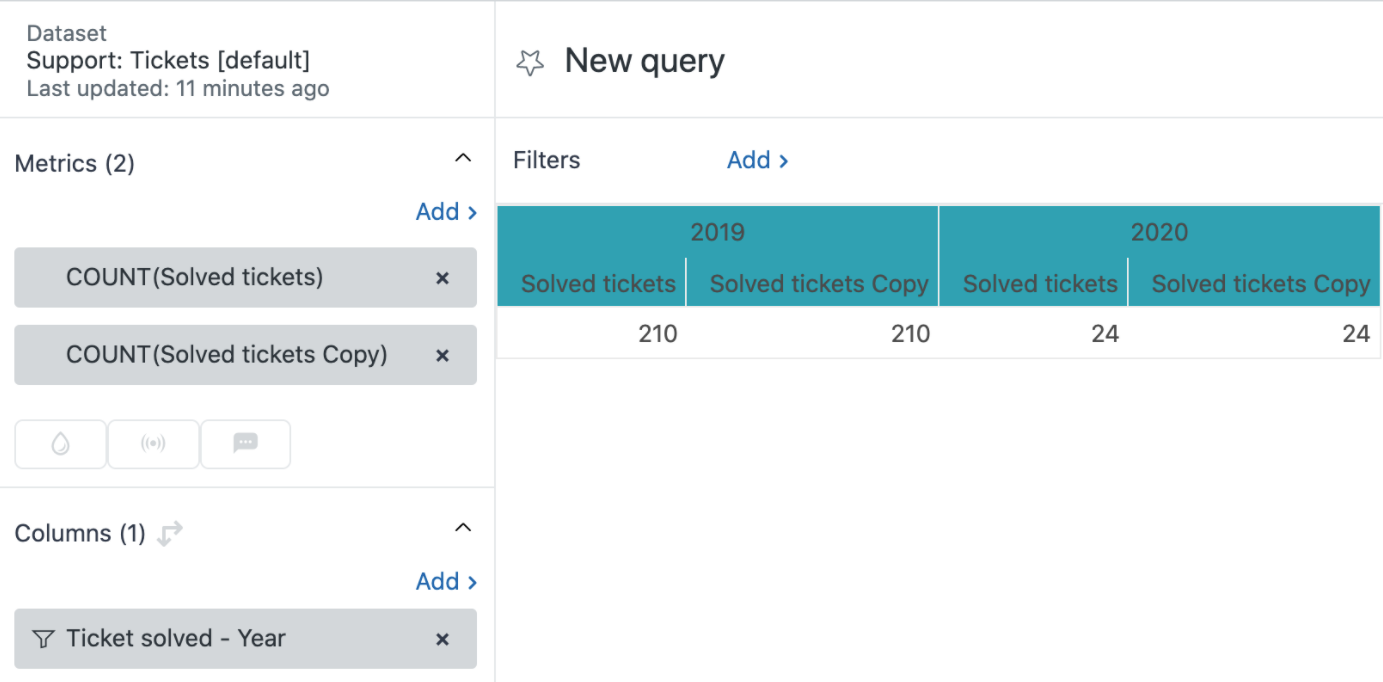
- Duplicate the metric of your report
- Add the result path calculation
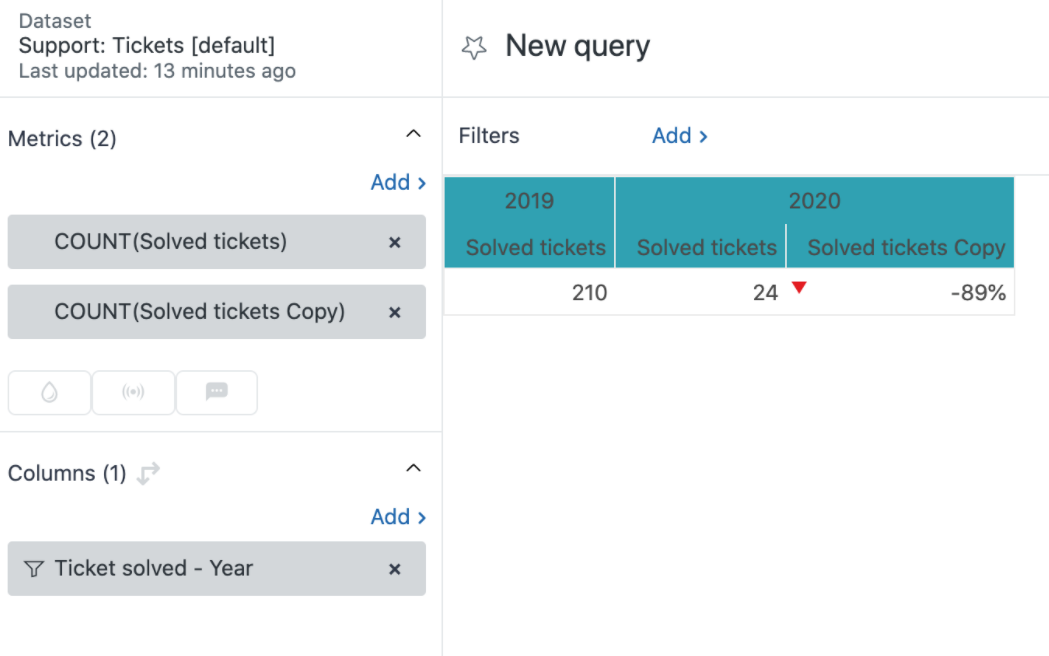
- Hide the empty columns and add arrows to the report
This article uses the Solved tickets metric and Ticket Solved - Year as an attribute filtered by the last two years. However, use this workflow for any other metric or attribute.
Duplicate the metric of your report
- In the metric panel, click the metric in your report. In this case, Solved tickets.
- Select the eye icon and the Standard calculated metric panel will open.
- Select Duplicate. Select the same dataset as the one used for your report. In this example, it is Support: Tickets. Select Ok.
- In the Metrics panel, click Add.
- From the list of metrics, choose Calculated metrics > Solved tickets Copy, then click Apply.

Add the result path calculation
- In the result manipulation menu (
 ), select Result path calculation.
 - In COUNT (Solved Tickets Copy), choose the below options:
- Pattern > % of difference
- Path > On columns
- Reference > Previous element
- Select Apply.

Hide the empty columns and add arrows to the report
- In the report, go to Chart Configuration (
 ) and select Columns.
- Hide the second column by clicking the Visible (
 ) icon in Column 2.
 - Select the checkbox Arrow in the Column 4 row.
- In the report, click Solved tickets Copy and change the title to Change.
