Summary: ◀▼
You can add interactive dashboard components so viewers can filter results by date, attribute values, ranges, or exclude values, then adjust reports with a change attribute option. You can also stop dashboard filters from overriding individual report filters. These tools help you build more flexible dashboards and let viewers explore data their own way.
For this reason, you no longer need to migrate your existing Explore dashboards to the new dashboard builder. If you’ve already migrated, don’t worry. The new dashboard builder will remain live for the foreseeable future, and you can continue to use it.
Agentic analytics will be available later in 2026. Read more about agentic analytics.
You can add interactive components to a dashboard so your viewers can interact with and customize their results. Only editors can add interactive components, but anyone with permission to view a dashboard can use them.
For help using interactive components, see Interacting with dashboards.
Related articles:
Filtering results
Viewers can use interactive filter components to restrict results to specific attribute values, date and number ranges, or the highest and lowest results. You can also prevent filters from applying to individual reports.
This section contains the following topics:
Filtering dashboards by time or attributes
Adding a time filter component
A time filter enables users to edit the displayed period for a dashboard.
- In the Dashboard menu, click + > Time filter.

- In the Time filters panel, select a date attribute to use in the filter.
The time filter component is added and will resemble the image below.

Using the time filter
Now that you've added a time filter, dashboard viewers can use it to configure the period displayed on the dashboard reports.
To change the displayed period
- In your dashboard, click your time filter.
- From the dropdown list, select the period for which you want to display
results, for example, Last 12 months.

Your dashboard reports refresh to display only data for the period you selected.
Adding a data (attribute) filter
A data filter enables viewers to filter results by an attribute's values. Viewers can divide data by an additional attribute without the results appearing on each report.
To add a data filter
- In the Dashboard menu, click + > Data filter.
- On the Choose data filter dataset panel, select the attribute by which you
want to filter.

You can either browse the available attributes in the list or refer to Understanding Explore datasets for a complete list of available values for your dataset.
Tip: If you choose a date attribute, think about how you want your viewers to be able to filter the dashboard. For example, a common filter might be the date the ticket was created, so you'd choose the Ticket created - Date attribute. The attribute you select must be part of the dataset used to generate the report you’ve added to the dashboard.
Your new filter is displayed. In this example, you've added a data filter to only show results for tickets that contain one or more selected tags.

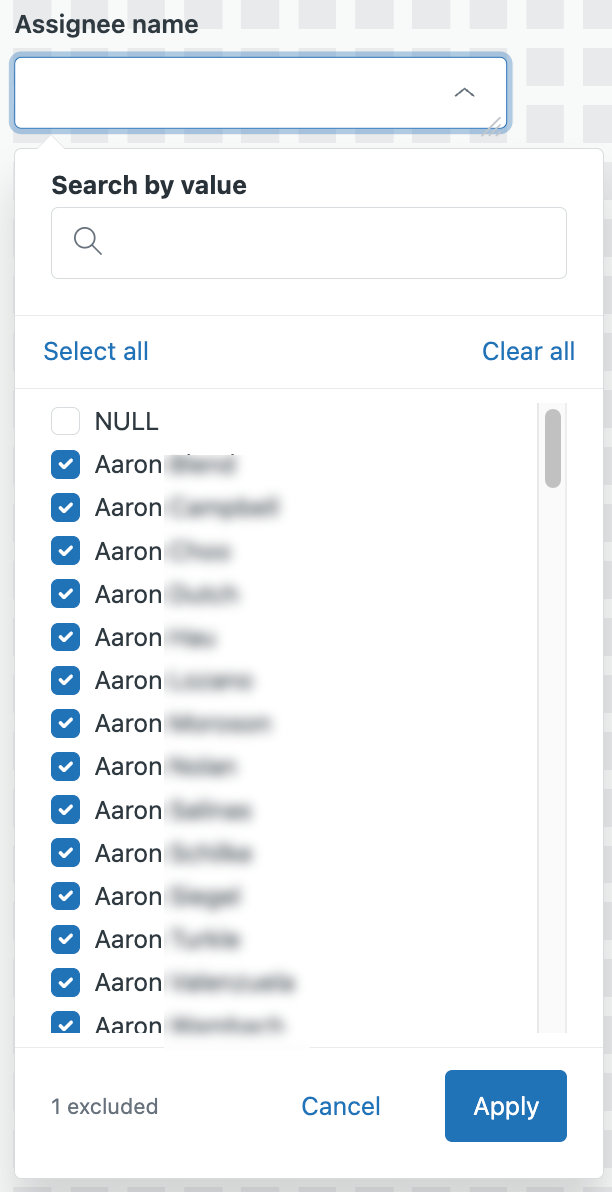
Using a filter to exclude values
In addition to using filters to specify values you want to include in a report, you can also use a filter to specify values you want to exclude.
To exclude values using a filter
- In a dashboard, click the filter you want to configure to exclude certain values.
- In the filter properties, click Select all.
- Click the values you want to exclude from the report. A count at the bottom of the filter displays the number of excluded values.
- When you are finished, click Apply. The dashboard updates to reflect your filter settings.
In this example, the filter is configured to exclude only NULL values from the report.
Selecting new attributes
When you select these interactive widgets, your viewers can edit the initial attributes to view other possible outcomes.
The following interactive widgets that enable your viewers to edit existing metrics or attributes:
Selecting a different attribute
The change attribute interactive component lets viewers select a new attribute for a report from a list you configure.
- In the Dashboard menu, click + > Change attribute.
- In the Add change attribute panel, select the dataset containing the attribute you want to become a change attribute.
- Select the attribute that will become a change attribute.
- After you select an attribute, you can edit the display format and restrict the list
of available attributes.
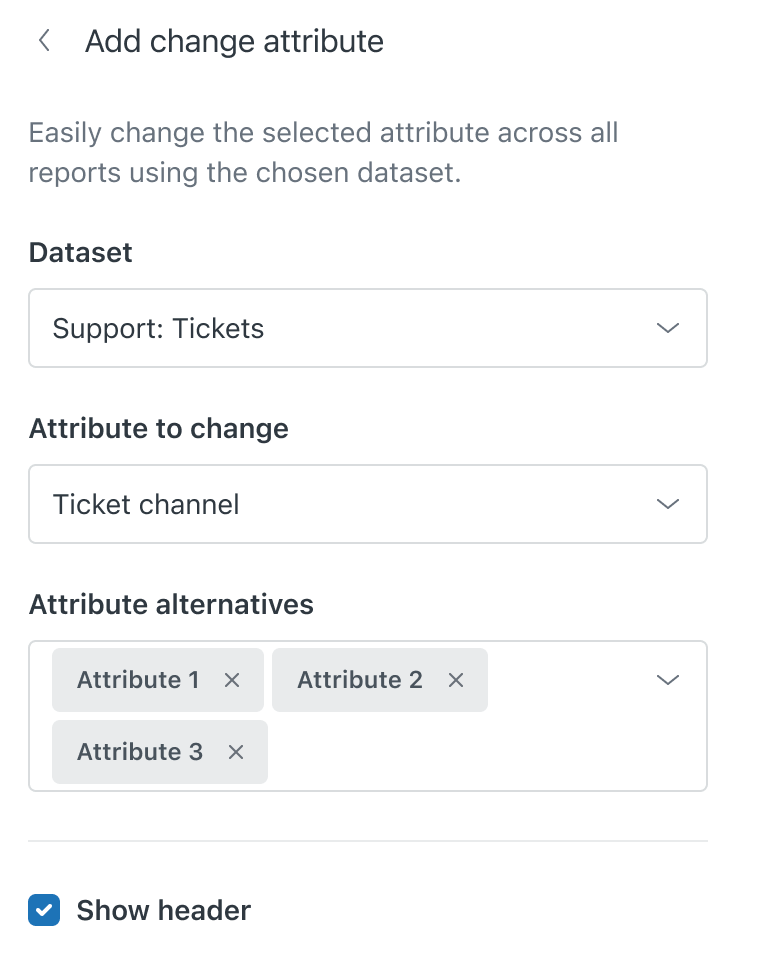
- When you are finished, click Add.
Your change attribute component is displayed and will resemble the image below.

Excluding reports from dashboard filters
You can prevent dashboard filters from applying to individual reports within the dashboard. This is helpful if you don't want dashboard-level filters to overwrite the filters configured in the report itself.
To turn off dashboard filters for a report
- Select a report in the dashboard. The filter options menu displays.
- From the Exclude from filters dropdown list, select the filters you want to exclude from
your report.

Your dashboard updates with the new filter configuration.