Verified AI summary ◀▼
Monitor your automated resolution usage to ensure it aligns with your plan. Use the dashboard to track daily usage and forecast future needs. Alerts notify you when nearing limits, with details available at both conversation and account levels. Stay informed with usage banners and email notifications, and adjust configurations as needed to manage your resolution allowance effectively.
You can track your automated resolution usage on the automated resolution platform (prior to resolution tiers), which can help you determine whether your plan-based automated resolution baseline meets your needs. When you are near your automated resolution limit, you'll be alerted in Admin Center and your billing admin will receive an email notification.
This article describes how to monitor automated resolutions usage on the automated resolution platform (prior to resolution tiers). If you're not sure which platform your account is using, you can check which version your account is using.
This article contains the following topics:
Related articles:
Viewing the Automated resolutions dashboard
The Automated resolutions dashboard provides a look into how many automated resolutions you use on the automated resolution platform (prior to resolution tiers). The dashboard can help you determine how well your AI agents resolve customer support requests and whether you should change your current configurations. This information can also help you forecast your future automated resolution needs.
To view the Automated resolutions usage dashboard
- In Admin Center, click
 Account in the sidebar, then select Usage > Automated resolutions.
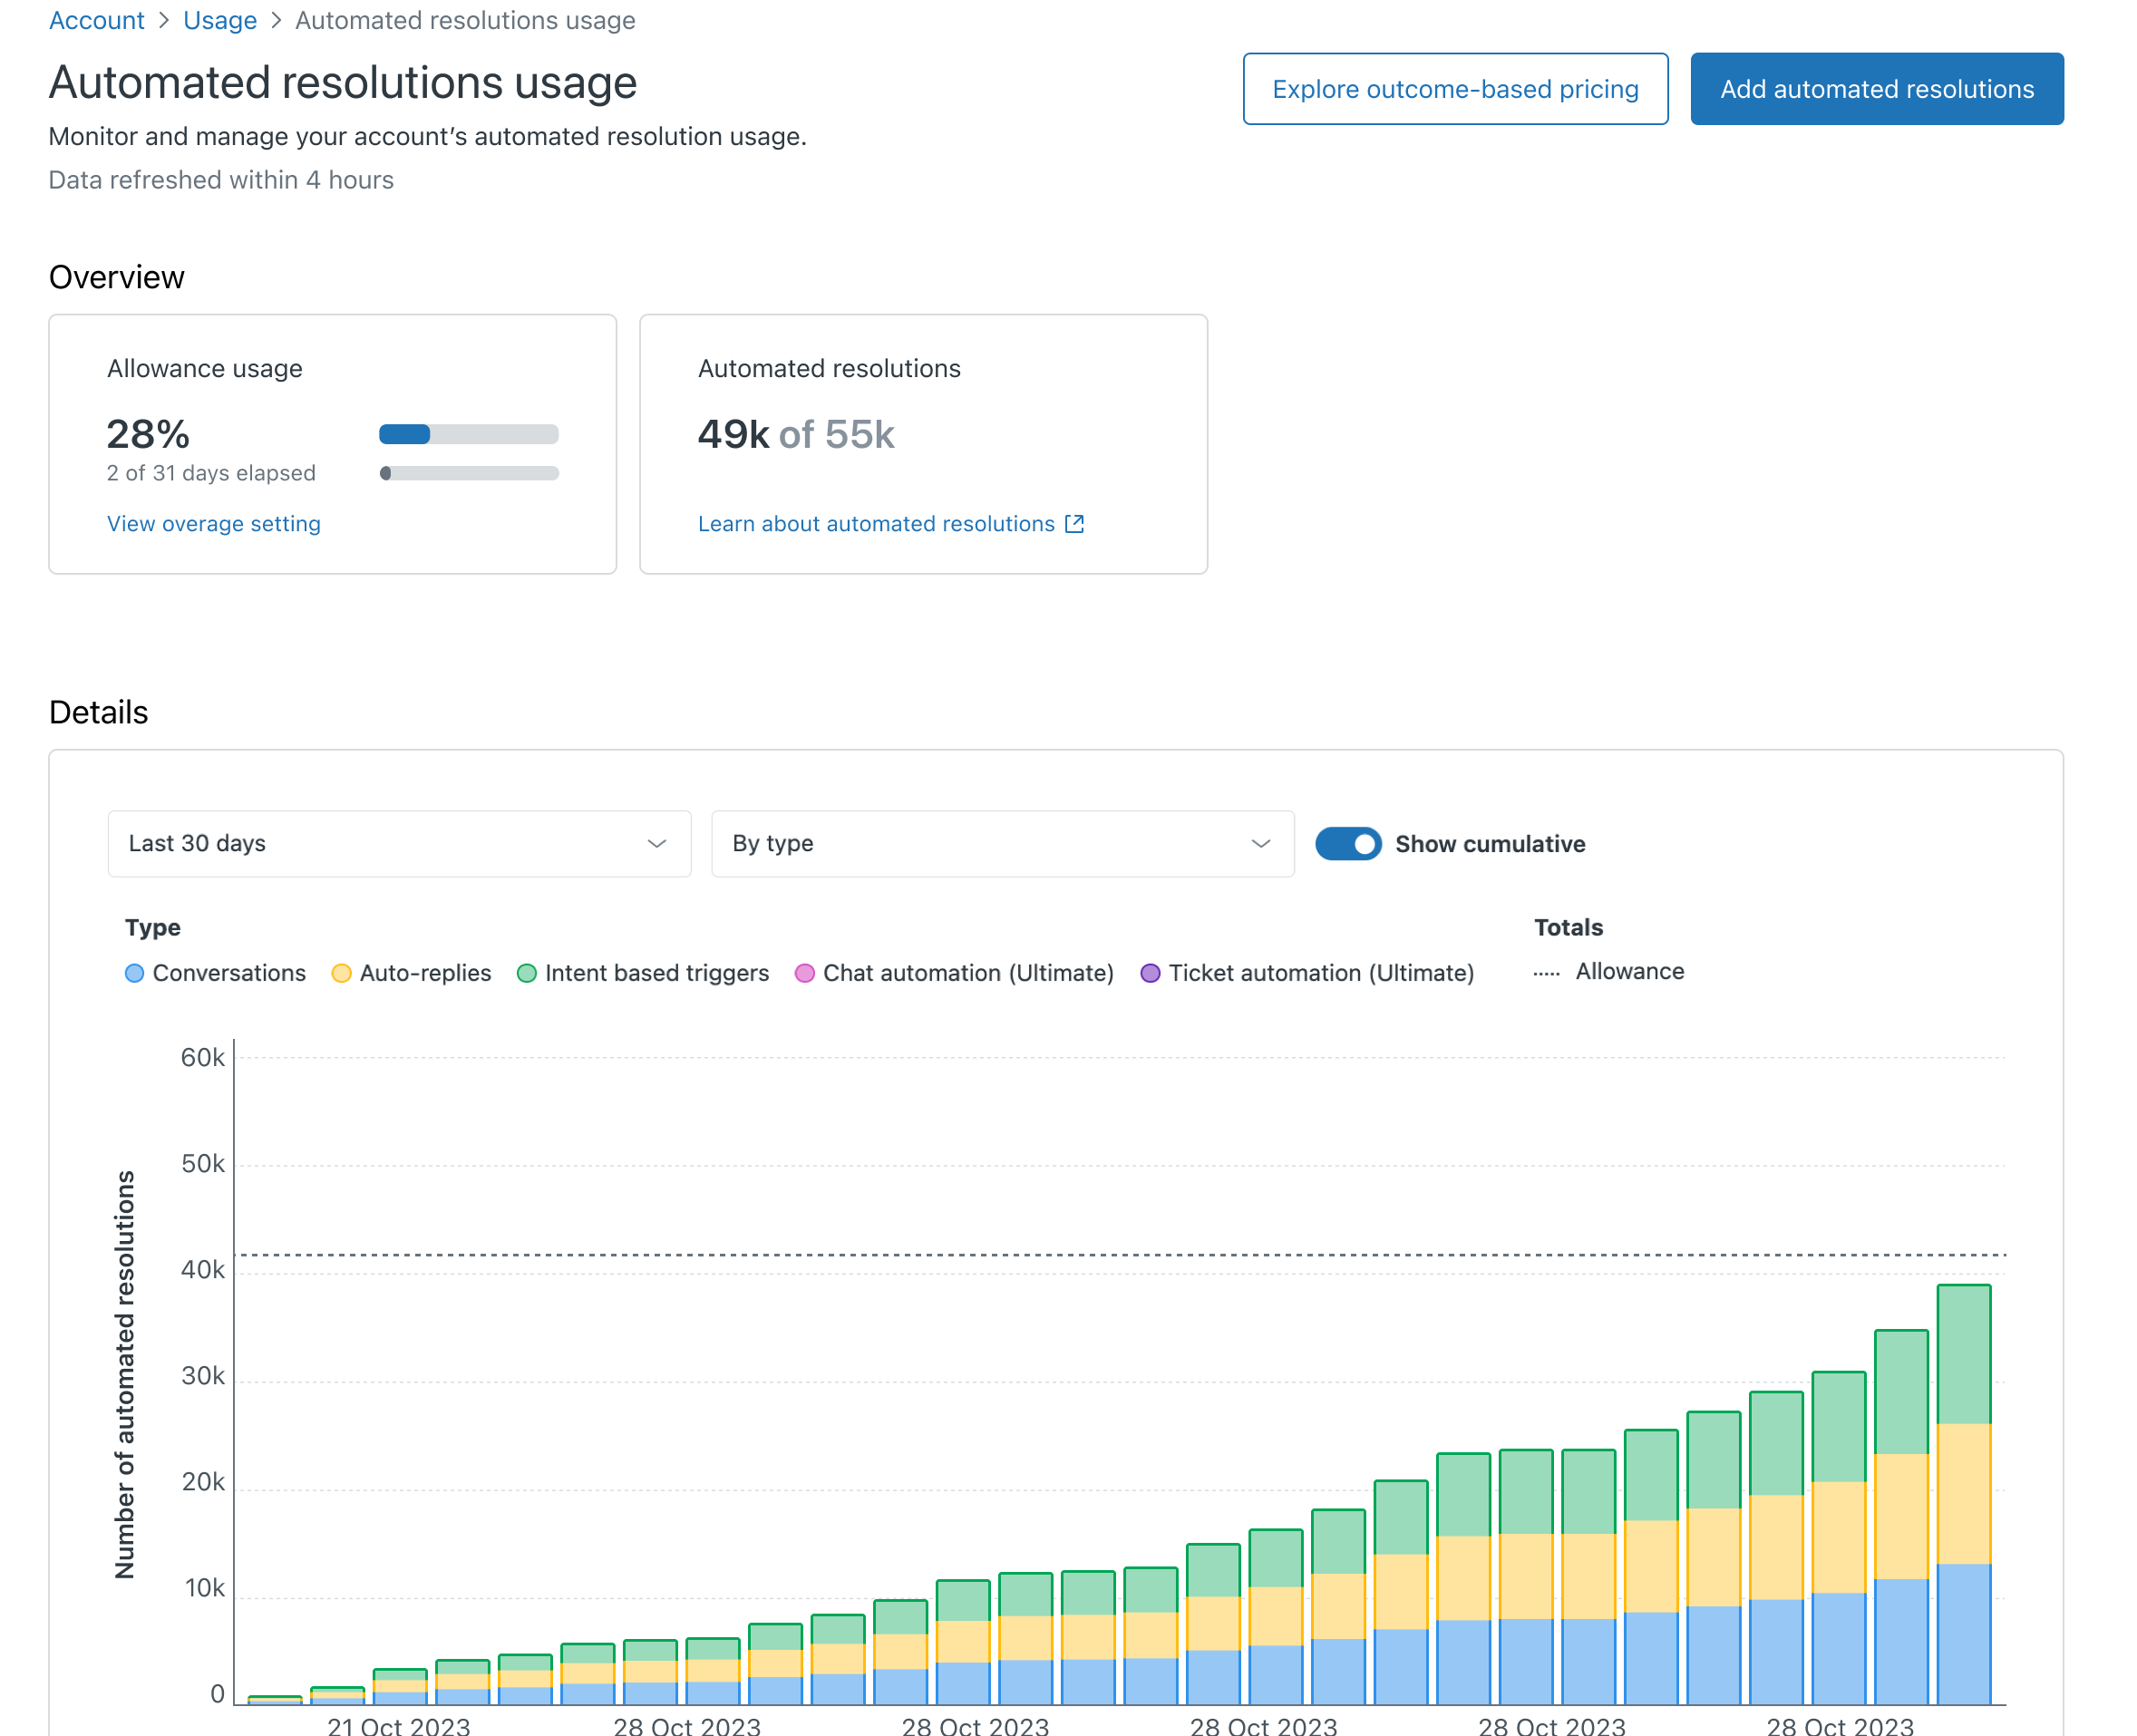
The dashboard includes basic information about your automated resolution usage.
-
Overview
- Allowance usage displays the percentage of automated resolutions used in the current billing period.
- Automated resolutions displays the number of automated resolutions used in the current billing period.
- Usage details displays a chart tracking the number of automated resolutions used per day for the selected time period. Use the drop-down menus to change the time span covered in the breakdown, as defined in Understanding how automated resolutions are measured, and to display usage by type of automated resolution used, or to group types together.
- Show cumulative toggles on or off the aggregate of usage for the subscription term.
The dashboard only displays data on confirmed automated resolutions.
From the dashboard, you can access the page to manage your automated resolution overage setting and add automated resolutions to your account.
Monitoring automated resolutions at the ticket level
Tickets include helpful indicators when an automated resolution is consumed on the automated resolution platform (prior to resolution tiers), including a ticket field and an entry in the events view.
Deleting a ticket with a Resolution type value of Automated doesn’t undo the consumption of an automated resolution.
- In Support, open a ticket.
- View the Resolution type field, which lists Automated as the value when an
automated resolution is consumed.
The Resolution type field can be used when creating custom reports.
- Click the events icon (
 ) in the conversation header to
view the date and time the automated resolution occurred.
) in the conversation header to
view the date and time the automated resolution occurred.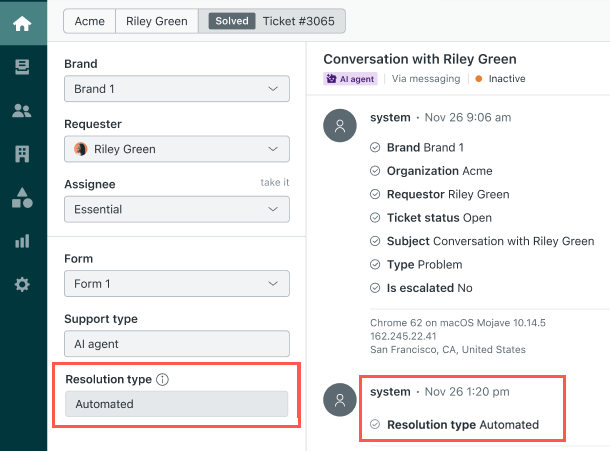
Monitoring automated resolutions at the conversation level
At the conversation level, automated resolutions on the automated resolution platform (prior to resolution tiers) are indicated in the Conversation Logs.

To view a conversation’s automated resolution verification details
- In the AI agents workspace, select the AI agent you want to work with.
-
Click
 Conversation logs in the sidebar.
A list of conversations appears for the default time frame (the past 7 days). If you don’t see any conversations, adjust the time frame.
- (For messaging AI agents only) Toggle the Status / Custom resolutions setting at the bottom to switch between showing either the conversation status or custom resolution values.
- From the list, select a conversation with the automated resolution icon
(
 ).
).The automated resolution icon (
) appears beside any
conversation that consumes an automated resolution. Additionally, you
can drill into a specific conversation to see an explanation of the
automated resolution verification. - Click Details.
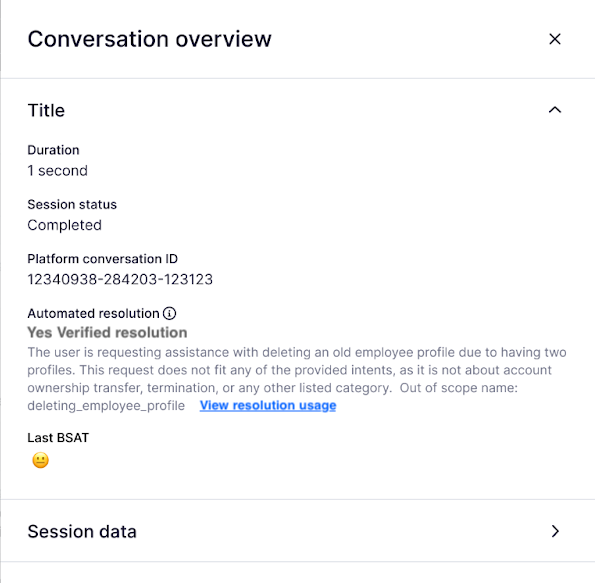
In the Conversation Overview panel that opens on the right, the Automated resolution section includes an explanation.
Monitoring automated resolutions at the account level
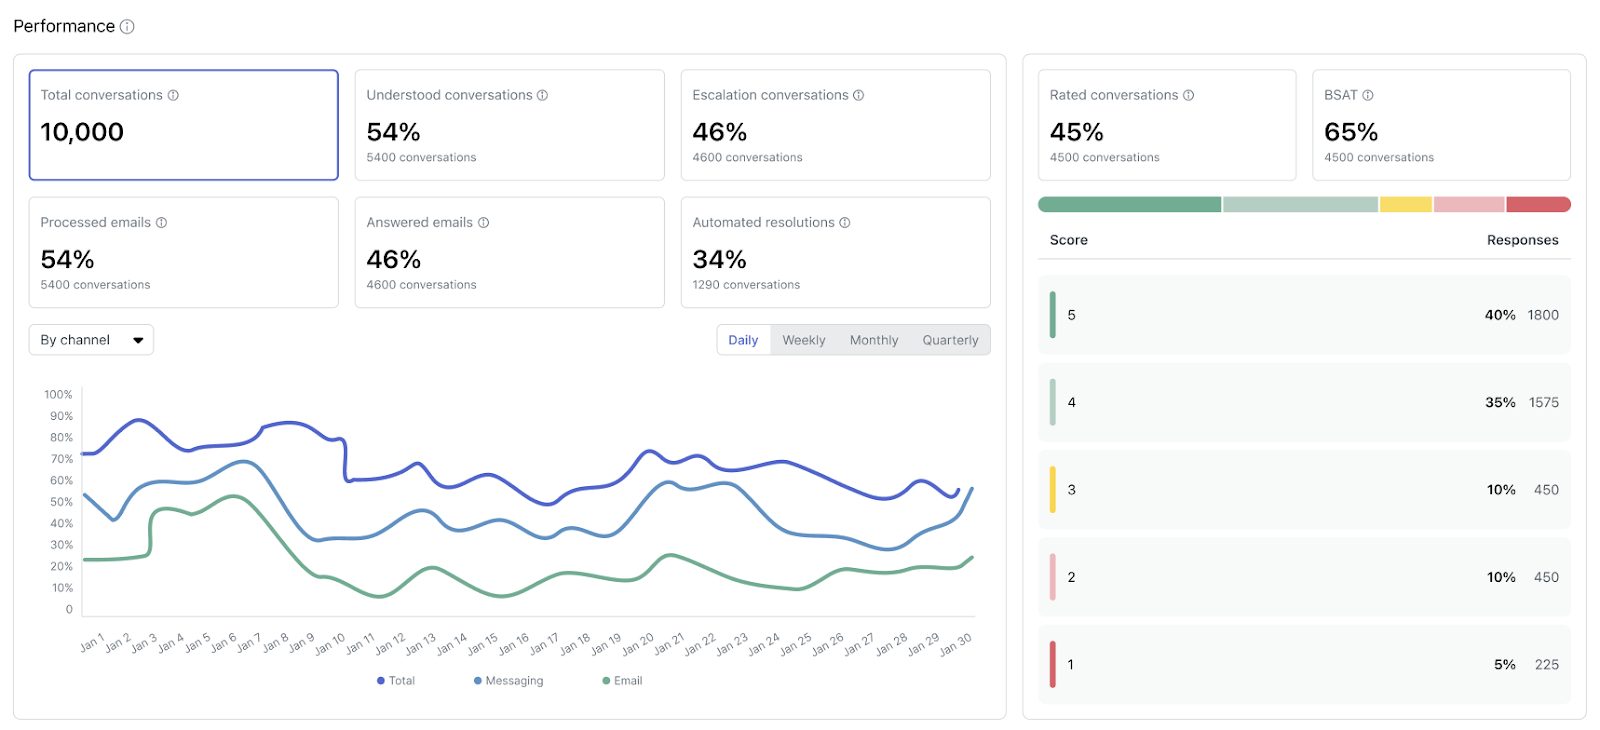
At the account level, automated resolutions on the automated resolution platform (prior to resolution tiers) are reported in the Reporting dashboard. This dashboard includes automated resolutions reporting that shows your automated resolutions usage at the account level. For details, see Analyzing advanced AI agent performance with the reporting dashboard.
Viewing automated resolution usage banners
On AI agent pages in Admin Center, overage warning banners notify you when you’ve used 80% of your automated resolutions on the automated resolution platform (prior to resolution tiers), and the banners update when you’ve used 100%. Banners include basic information about what happens when you reach your limit based on your automated resolution overage setting to either maintain functionality and allow overage or pause functionality and not allow overage.
You can't dismiss these banners and they will remain visible until automated resolutions are again available for your account when your billing cycle resets or you purchase additional automated resolutions.
Overage warning banners appear on related Admin Center pages, including:
-
The parent AI agents page, as well as the following child pages:
- AI agents for messaging
- AI agents for email and web form
- The Resolution usage dashboard
- The Web Widget (Classic) page (for some legacy configurations)
Overage warning banners also appear on every page in AI agents.
If you choose to pause AI agent functionality when you reach your automated resolution limit, notifications will appear on the admin pages for each of the paused capabilities.
Additionally, your account owner and billing admin will receive an email notification when you've used 80% of your automated resolutions, and again when you've used 100%.
Forecasting automated resolution usage
The Forecast tab in the Resolution usage dashboard helps you understand how your current usage trends could impact your allowance on the automated resolution platform (prior to resolution tiers).
Forecasted values are estimates based on past usage. Continue to monitor your usage using the suggestions included in this article.
This section includes the following topics:
The Forecast tab
The Forecast tab includes the following information:
-
Forecast metrics are at the top of the tab.
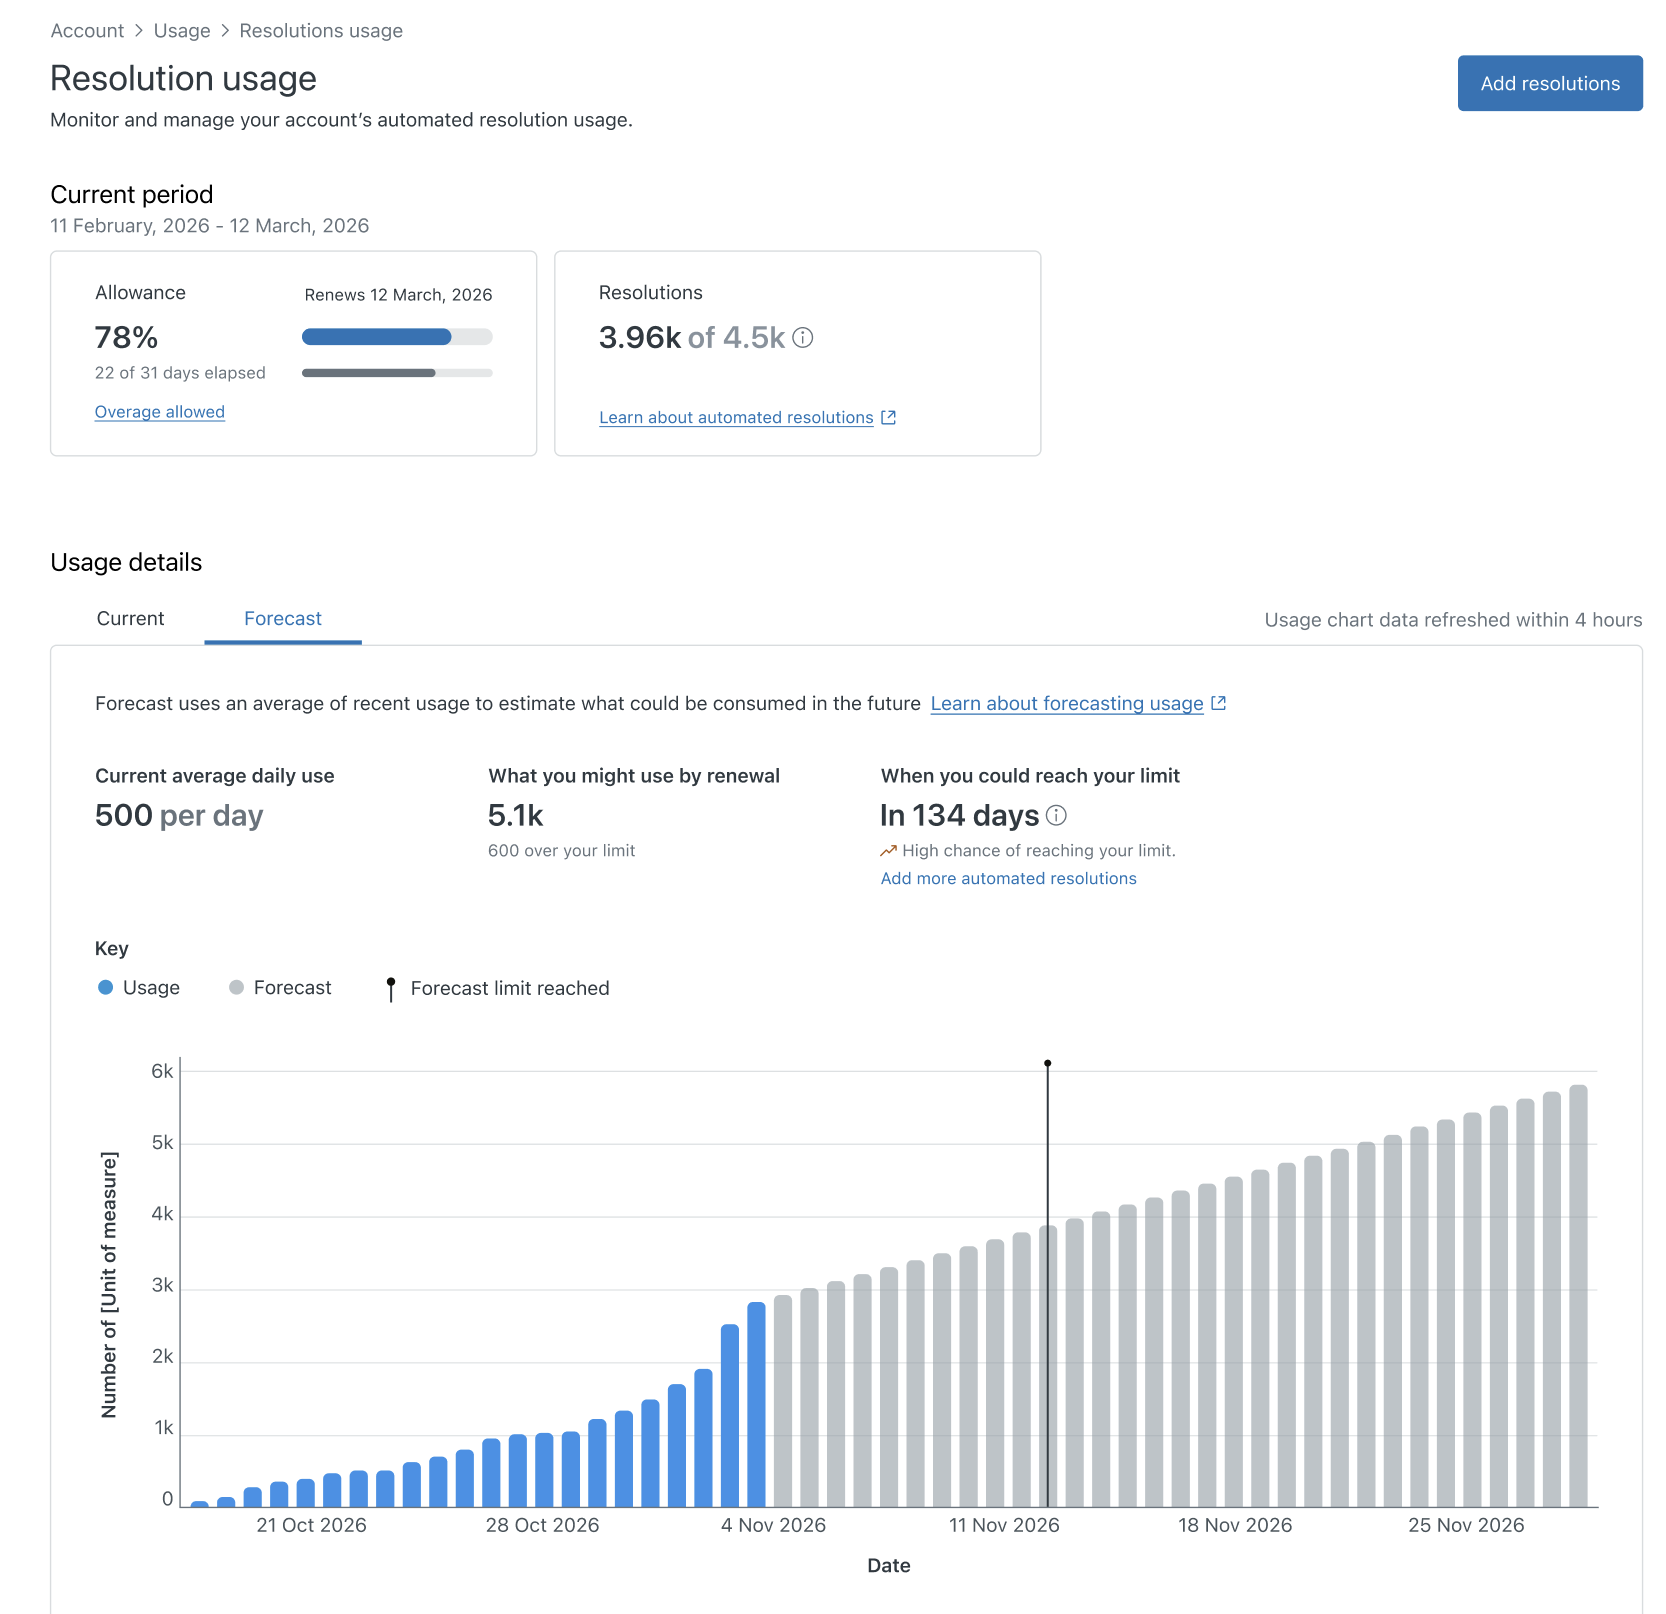
- Current average daily use shows your projected daily usage, based on the last 7 to 30 days. The forecast uses a moving average of your recent usage, excluding today’s usage. A minimum of 7 calendar days of usage history is required to generate a forecast.
- What you might use by renewal estimates your total projected usage by the end of your current allowance cycle. If this number exceeds your total allowance, the forecast will show how far over your limit you’re projected to go.
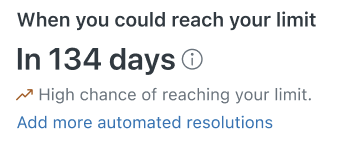
- When you could reach your limit If your projected usage exceeds your allowance during the current cycle, the forecast displays the estimated date your allowance may be exhausted, the number of days until that point and a warning indicator if there is a high chance you will exceed your limit
- Forecast usage chart shows your activity over time. Actual usage is in blue, forecasted usage is in grey, and your total allowance is a black vertical line.
How forecasting calculations work
To forecast your automated resolution usage, metrics from across your account are considered. In this section, we’ll list the information we look at and describe how it’s used in the calculations displayed in the forecasting chart.
-
Data source: Historical usage data for the past 7–30 days.
-
Calculation: A moving average model determines the average
daily usage, which is projected forward to the end of the allowance cycle.
We do not include the current day's usage when calculating this
forecast rate, even if some resolutions have already been consumed today.
- Zero-usage days are treated as valid data points (with value = 0) in the forecast calculation
- If there are at least 7 calendar days since first usage, we show forecast data using that range (even if some days have zero usage)
- If there are fewer than 7 calendar days since first usage, forecast returns “Not enough data” for forecasting (minimum 7 days required)
-
Allowance limit reach date: We calculate the remaining allowance
(total allowance minus cumulative usage to date) and divide it by the
forecasted daily usage rate to determine how many days are left until the
allowance is exhausted. We then add those remaining days to today’s date to
estimate when the customer will reach their allowance limit.
- Forecasted allowance limit reach date calculation metrics:
- Remaining Allowance = Total Allowance − Cumulative Usage to Date.
- Days to Exhaust = Remaining Allowance ÷ Forecasted Daily Usage Rate.
- Forecasted Reach Date = Current Date + Days to Exhaust.
- If the forecasted allowance reach date is:
- Within the current cycle, we show the date and days until
the allowance is reached. If your account is projected to
exceed the allowance before your renewal, it’s considered
“above target”. The indicator displays an orange uptrend
arrow () labeled (“High chance of reaching your limit”),
along with a link to your subscription page where you can
add more
resolutions.
- Falls after the current cycle ends, it isn't t shown, as it lies outside the active cycle.
- Already reached, we display the past date on which the limit was reached. This date always falls within the current allowance cycle.
- Within the current cycle, we show the date and days until
the allowance is reached. If your account is projected to
exceed the allowance before your renewal, it’s considered
“above target”. The indicator displays an orange uptrend
arrow () labeled (“High chance of reaching your limit”),
along with a link to your subscription page where you can
add more
resolutions.
-
Display mode:
- Cycles ≤ 90 days show daily usage forecasts.
- Cycles > 90 days show monthly usage forecasts.
- We do not forecast for the current day. Forecast bars are always displayed from next day. This is same for Daily view and Monthly view.
- Forecast updates: The chart refreshes every 4 hours to include the latest usage.
- Forecasted allowance limit reach date calculation metrics:
Forecasting scenarios
If you're projected to exceed your allowance, you'll see:
- Your projected total usage by the renewal date, including how many automated resolutions you’re expected to go over your allowance.
- An estimated limit reach date and the number of days remaining until your allowance is expected to be exhausted.
- A warning indicator highlighting a high likelihood of exceeding your limit
- A link to add more automates resolutions.
If you're on track to stay within your allowance, you'll see:
- Your projected total usage by the renewal date. No reach date is shown because your projected usage does not exceed your allowance.
At the start of the new allowance cycle:
- Your usage resets to zero.
- Your forecast recalculates automatically based on your most recent 7–30 days of activity.