Analytics displays a series of reports, giving you an overview of your chat and agent activity. With this data you can optimize your customer support strategy and improve its efficiency.
Using Analytics: Chat reports
The Chat reports tab displays information on all the chats in your account, including:
Chat stats
The Chat Stats graph lets you compare the volume of chats with their timing trends, on an hourly, daily, or weekly basis.

Determine your busiest periods by observing visitor wait times, response times, satisfaction ratings, and acceptance rate, and the number of chats served and missed by your agents at any given time. The graph includes a stacked bar chart with all served and missed chats, giving you an overview of your agents chat load in any given time period.
Next to each metric is an up/down arrow comparing the currently selected period with the previous one. For example, if your currently selected period is Last 7 Days, then it will compare the number of served chats, missed chats, and your chat timings with the previous seven day period.
Satisfaction ratings
The Satisfaction Ratings section shows the percentage of chats rated Good and Bad for the given time period.
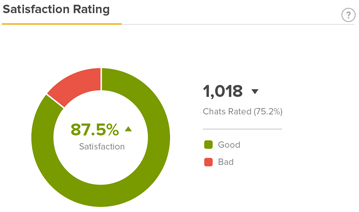
Click on either portion of the graph to see chat history details for chats with that rating.
Chat timings
The Chat Timings section shows you chat response times, chat lengths, how long visitors waited before first receiving a response, and the time between a visitor's last reply and when they ended the chat (without an agent response). This graph can help you see if your efforts in improving visitor wait times have had an effect.

Using Analytics: Agent reports
The Agent Reports tab shows graphs of overall and individual agent activity on your account, including:
Viewing activity for all agents
On the All Agents tab, you can see the number of agents logged in versus various chat metrics.

- Click the Leaderboard tab to see a list of agents sorted by who has served the most chats.
- Click any of the other column headings to sort by that
column.

-
Select the Leaderboard dropdown menu in the upper right and choose Agents Logged In, Agents Online, or Agents Serving to see a schedule for each group of agents for the given time period. Note that this feature only shows logged in times to the nearest hour.

Viewing activity for individual agents
Click the Individual Profile tab at the top of the page to see a specific agent's activity, including total time serving and logged in, when the agent was last seen, total number of served chats, acceptance rate, and satisfaction ratings. You can also view the agent's individual activity by clicking the magnifying glass next to their name from the Leaderboard.


- Response Time refers to the average time it takes for this agent to respond to the last visitor message in that chat.
- Average Response Time refers to the average value of the average response time across all the agents chats.
Click the Satisfaction tab to see an overview of the agent's satisfaction ratings and related comments.

Filtering Analytics reports
You can filter your analytics reports by the certain criteria, including:
Filtering by time range
You can view Chat and Agent Reports data for any of the following preset time ranges:
-
Last 1 day (24 hours)
-
Last 7 days
-
Last 14 days
-
Last 30 days
You can also select a custom time range.

Data in the Chat Stats graph can be viewed on an hourly, daily, or weekly basis. Hourly data is limited to a 24 hour period, daily data is limited to 31 days and weekly data is limited to 90 days.
The data in all graphs includes the last full day that has passed. For example, the “Last 1 day” hourly data includes the last 24 hours from the the previous midnight.
Filtering by department

Deleted departments are not displayed in the filter department dropdown list, and any historical Chat data linked to any deleted Chat departments is not included in the analytics dashboard.
Exporting Analytics data as a CSV file
You can export your Chat and Agent Reports into a CSV file. In the exported CSV file, the first row of data will always start from 00:00 of the selected timezone.
For details about the metrics that are exported to the CSV file, see the Analytics CSV glossary.
To export data into a CSV file
- Click Download CSV in the upper right-hand corner.
- Select the reports, date range, interval, and recipients in the window that
appears. Emails must already be registered in your Zendesk Chat account. You can
enter multiple emails separated by commas. Enterprise accounts can choose to
export data by department.

- Click Send.
Receiving email reports of Analytics data
You can receive Analytics email reports weekly, monthly, or (for Enterprise accounts) daily.
To enable Analytics email reports- From the dashboard, go to Settings > Personal.
- Click the Email Reports tab.
- Select the Enable email reports check box.

- Select the frequency of reports you want to receive.Note: Only Enterprise accounts have the option of daily email reports.

- Click Save Changes.
Monitoring chat capacity
Capacity is the estimated amount of chats that can be served by the account in a given period of time. The capacity is a function of the number of agents logged in, the average chat duration of an account, and the chat limit set by the agent. Under Agent Reports > All Agents, you can compare capacity with total chat volume to get a sense of how over- or underutilized your agents are based on your current chat routing settings. For details about chat routing, see Setting up Chat Routing.

- From the dashboard, select Analytics.
- Click the ... menu in the upper right corner.
- Select Enable Capacity.
