Explore offers a prebuilt dashboard that displays your Zendesk Support data. You can edit and customize this dashboard by cloning it (see Cloning dashboards). Use this article to learn about the reports available in this dashboard.
This article contains the following topics:
Opening the Support dashboard
To open the Support dashboard
- In Explore, click the Dashboard icon (
 ) in the left sidebar.
 - From the list of dashboards, select the Zendesk Support dashboard.
Understanding the reports
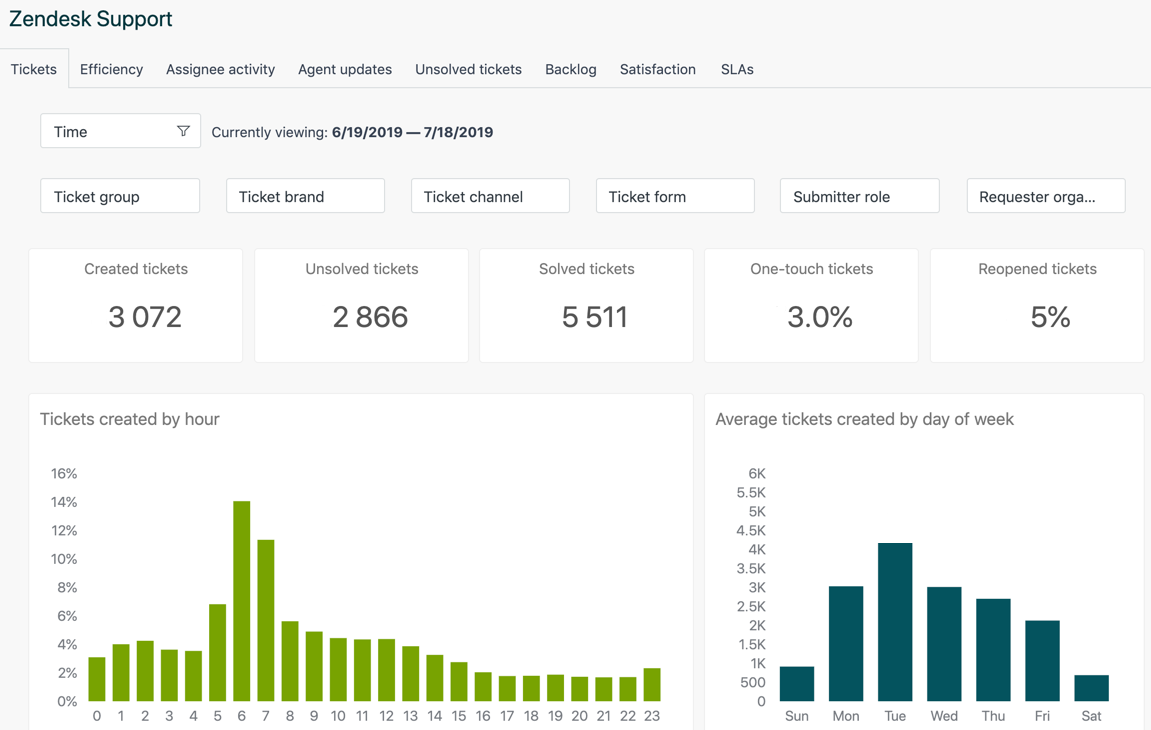
The Support dashboard is split into eight tabs
- The Tickets tab contains reports about tickets created in your Zendesk account. You can filter the reports by date, group, brand, channel, form, submitter role, and requester organization.
- The Efficiency tab contains reports that help you evaluate the efficiency of your agents. You can filter the reports by date, group, brand, channel, form, priority, and requester organization.
- The Assignee Activity tab helps you to see the results when you assign tickets to agents and others. You can filter the reports by date, group, assignee, brand, channel, form, and requester organization.
- The Agent Updates tab shows comments and updates made to tickets by your agents. You can filter the reports by date, agent, brand, channel, form, group, and requester organization.
- The Unsolved Tickets tab helps you take a detailed look at tickets in your account that are still open and require attention. You can filter the reports by group, assignee, brand, channel, priority, and requester organization.
- The Backlog tab helps you look at open ticket activity over a date range you select. You can filter the reports by group, assignee, brand, channel, priority, and type.
- The Satisfaction tab helps you take a closer look at customer satisfactions (CSAT) scores for your tickets. You can filter the reports by date, group, brand, channel, form, priority, and type.
- The SLAs tab helps you measure your results against SLAs you configured. You can filter the reports by date, SLA policy, SLA metric, group, brand, form, priority, and requester organization.
- The Group SLAs tab helps you measure your results against group SLAs you configured. You can filter the reports by date, group SLA policy, group SLA metric, group, brand, form, priority, and requester organization.
To learn about the available reports on each tab, see Analyzing your Support ticket activity and agent performance.