Explore offers a pre-built dashboard that displays your Zendesk Support data. You can edit and customize this dashboard by cloning it (see Duplicating pre-built dashboards). Use this article to learn about the reports available in this dashboard.
This article contains the following topics:
Opening the Support dashboard
To open the Support dashboard
- In Zendesk Support, open the product tray.
- Click the Explore icon (
) .
- From the list of dashboards, choose the Zendesk Support dashboard.
Understanding the reports
The Support dashboard is split into eight tabs
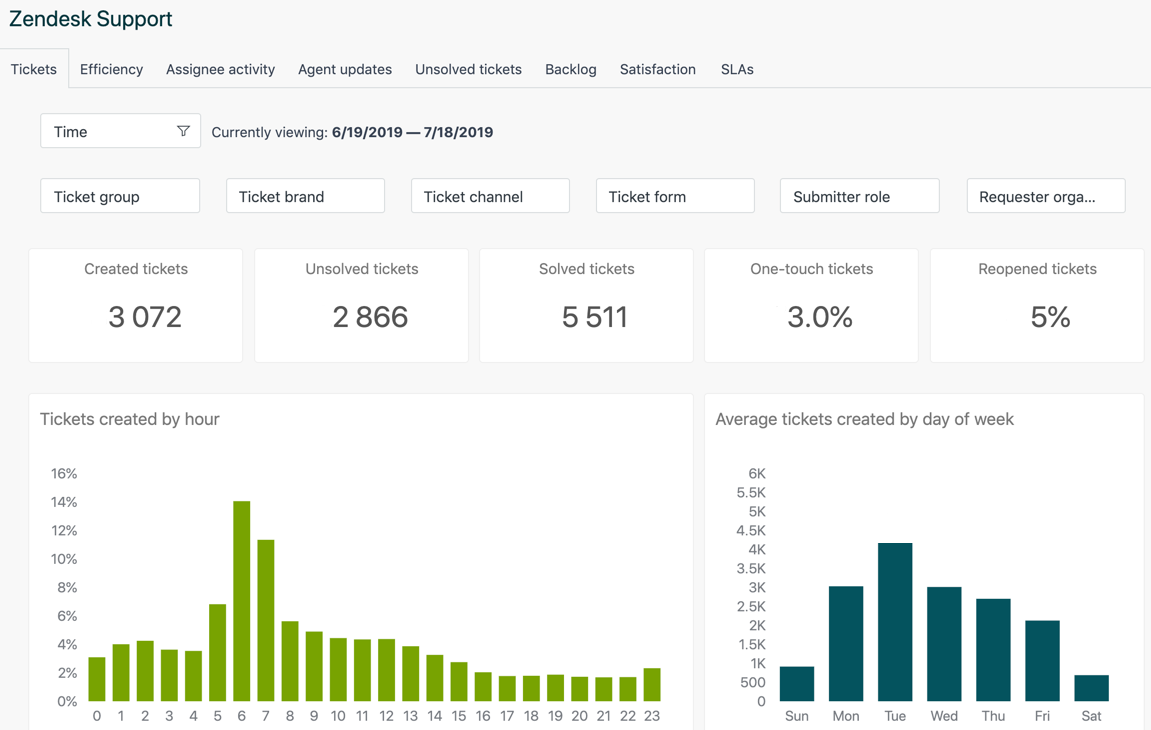
- The Tickets tab contains reports about tickets created in your Zendesk account. You can filter the reports by date, group, brand, channel, form, submitter role, and requester organization.
- The Efficiency tab contains reports that help you evaluate the efficiency of your agents. You can filter the reports by date, group, brand, channel, form, priority, and requester organization.
- The Assignee Activity tab helps you to see the results when you assign tickets to agents and others. You can filter the reports by date, group, assignee, brand, channel, form, and requester organization.
- The Agent Updates tab shows comments and updates made to tickets by your agents. You can filter the reports by date, agent, brand, channel, form, group, and requester organization.
- The Unsolved Tickets tab helps you take a detailed look at tickets in your account that are still open and require attention. You can filter the reports by group, assignee, brand, channel, priority, and requester organization.
- The Backlog tab helps you look at open ticket activity over a date range you select. You can filter the reports by group, assignee, brand, channel, priority, and type.
- The Satisfaction tab helps you take a closer look at customer satisfactions (CSAT) scores for your tickets. You can filter the reports by date, group, brand, channel, form, priority, and type.
- The SLAs tab helps you measure your results against SLAs you configured. You can filter the reports by date, SLA policy, SLA metric, group, brand, form, priority, and requester organization.
To learn about the available reports on each tab, see Analyzing your Support activity with Explore.
28 Comments
Hi Jessica. Was the Ticket Tag Usage report removed from the Overview Dashboard? I don't see it on our version.
I'm also seeing the First Reply Time metric on the Leaderboard in minutes instead of hours. Is there a way to change that?
Hi Chris, sorry about the slow response.
For your first question, I couldn't find record of a tag usage report. Can you clarify?
For your second question, there doesn't seem to be a way of changing from minutes to hours in the pre-built report. You could clone the dashboard and edit the leaderboard query, replacing the columns for First Reply Time - Min and Full Resolution Time - Min
I believe that using First Reply Time - Bus Hrs and Full Resolution Time - Bus Hrs would give you the data you want.
Alternatively, you might be able to apply a transformation to the result to divide it by 60, then rename the column headings. However, again, you would need to clone the dashboard.
Hi Rob,
It's been so long, I'm not even sure what I was referring to with the tag usage report. I knew we could clone the time reports and put them in hours. I guess that was more of a feature request, to have a toggle for minutes/hours. But if the only way to do it is through a hard code in the metric then that's probably not a thing. Thanks for the reply.
Greetings,
We are looking to use these however the challenge we are looking to overcome is how to add a filter that would apply to all tabs that by default would filter the results by Ticket Group.
Any ideas would be awesomesauce!!
Hi Jason, consider this as a starting point of an idea, but you might be able to use bookmarks to "freeze" the filters to ticket group. You can't edit the pre-built dashboard, but you could clone it to make an editable copy.
Starting point for reading - https://explore.zendesk.com/hc/en-us/articles/236023527-Adding-dashboard-interactions#topic_kbd_rzg_2v .
I hope this helps!
Thats a great launching point. Thanks Rob!!!!
What is the sync speed of data from Support to Explore? In running a report for 12-31 through 1-6, all data bast 1-2 is missing entirely from all report tabs in Explore. Edit: A few minutes later, I refreshed and the correct date range of data appeared. Not sure why that happened, but all is well now.
Hello James,
Thanks for posting your question. Generally speaking, accounts on the Professional plan will sync once every 24 hours. Accounts on the Enterprise plan will sync one hour after the most recent sync ended. Synchronization times will vary based upon how much data is being synced.
It's a bit difficult to know what could be causing your reports to not reflect any data for the mentioned span of time. This can sometimes be due to a filter set on the report or there not being any account data which matches the criteria of your report. I would however like to take a closer look at what you're seeing. You should see a ticket from me shortly.
Thanks Katie, I responded to your ticket, the problem auto-resolved. I believe that I was trying to access the data too early, or had a browser cache issue but shortly after writing the comment the data populated as expected. I appreciate your quick response!
Hello,
I can't seem to find the SLA and Backlog tabs on the default Zendesk Support dashboard.
I can understand that the SLA tab is not present as we haven't defined SLA yet, however I don't understand why the backlog's tab is not present.
Any intel on this?
Hi Jaïs,
Thanks for reaching out!
Your inquiry requires further investigation, so I'm opening up a ticket on your behalf. Please check your email and we can continue troubleshooting from there.
For Satisfaction, what is the "Date" filter implying? Date ticket was solved? Date ticket was rated? Something else?
Hi Justin!
Date Ticket Solved is implied for the date of Satisfaction. It isn't obvious on the dashboard itself but if you take a look at the individual metrics the Solved Date is always the thing being referenced.
Hope that helps!
I cannot find an option to download the raw data of satisfaction surveys filled by customers. Is it limited based on the subscription I have?
Hey Setu!
My apologies, I was recently able to confirm this as well. Zendesk Satisfaction Survey Comments and Ticket IDs are not included in the Explore default Dashboards. If you are using Explore Lite there is not currently a way to view Satisfaction responses in the account without directly navigating to the ticket the comment was left on (and since the Ticket IDs are not exposed in the reporting this would only be possible if you were able to find that Ticket ID through some other means).
I have already brought this issue to attention to make sure this was not being overlooked but I do apologize that it may take some time before any updates can be pushed out to address this.
In the meantime it would be possible to find this information via the following methods:
Satisfaction rating searchable values
Satisfaction Ratings API Endpoints
Exporting data to a JSON, CSV, or XML file (Professional and Enterprise)
Would really be nice to be able to see satisfaction rating comments on the dashboard for ease of use!
Thanks for sharing your feedback Taylor!
I also recommend cross-posting in our Support Product Feedback forum which is the primary channel our Product Managers view.
Cheers :)
Where we can find the agent satisfaction ratings on Zendesk reporting. please help asap.
Hi Stutee Saxena -
To clarify, are you looking to find your ratings, or the ratings for your agents?
If you wish to report on your agents' ratings, you'll want to refer to this Explore recipe for reporting on customer satisfaction by agent.
To simply review your own rating, see the article on viewing customer satisfaction scores and rating.
I'm trying to figure out how I can drill into the pre-built dashboards to get the details behind the metrics. I have used many support systems in the past, and many reporting and/or analytics solutions, and I have never found it difficult to do this, yet with Zendesk Explore, I can't figure this out. I read a few articles that talks about how to enable the Drillthrough feature, another on how to enable it on pre-build dashboards - by cloning the dashboard and editing every single metric I want to drill into - which is just crazy, and yet when I click on the metric after doing all of this, nothing happens. What am I missing? And why is this so difficult? There has to be an easier way to get the tickets that make up a metric, and then be able to open the ticket to see the details - this is basic.
When I try the decompose function, which happens to appear on some metrics / charts, my session freezes
Hi Farhan Virji, thanks for the feedback. This is useful and I'll make sure it gets to the right place. Unfortunately, at present, the prebuilt dashboards, as you've discovered don't support drillthrough etc.
Having said that, it sounds like the behavior you're getting when you use drillthrough isn't right and we'd like to help you get to the bottom of it. Would you be willing for me to open a ticket on your behalf so our support team can take a look at what's going on? Thanks!
We are in a process to evaluate our agents based on their activities in zendesk support and now are able to export our agents activities such as comments, public comment, ticket solved, created etc from zendesk explore support dashboard. We have no doubt that its amazing tool to export such useful data that minimizes our effort for grading our agents !
but what we actually would like to obtain from this dashboard is number of voice mail tickets and email tickets that each of agents have taken voluntarily so that we can see how many of those new tickets created by email and voicemail that our users have sent or lefts us and our agents have taken.
so far we can only see the number of public comments that counts number of the msg and email agents send to user and again we would like to see the number of tickets of the email and voice mail from customer that each of agents have taken
for example, when we export the datas, we should see two datas at the very right " Email ticket taken " and " Voice mail ticket taken " so that we will be able to know how many tickets created by email and voice mail each of our agents has handled.
is there any metric we can export those data from ?
It would be greatful if you could point out how to create such section after cloning the dashboard
we couldn’t find any of metric that matches what we meant
Hey YB Choi,
You should be able to gather this information by adding the Ticket Channel attribute to your Explore query. More information on the Ticket Channel attribute here: Understanding ticket channels in Explore
Let me know if that doesn't get you the data you're looking for.
Hope this helps!
Hola, buen día!
Tengo el plan Professional, y no veo la pestaña de SLA y se bloquea la opción cuando quiero crear un panel.
¿Qué tengo que hacer para agregarla?
Gracias!
Eugenia
¡Hola, gracias por la pregunta!
En primer lugar, no hablo español, así que estoy usando el Traductor de Google para escribir esto. ¡Me disculpo si hay algún error!
Una de las razones más comunes por las que es posible que no vea la pestaña SLA en Explore es que aún no ha creado ningún SLA en sus tickets. Una vez que tenga SLA activos, la pestaña debería aparecer en Explorar dentro de una hora aproximadamente.
Hágame saber si este no es el problema y abriré un ticket en su nombre.
¡Gracias!
(Hi, thanks for the question!
Firstly, I don’t speak Spanish, so am using Google Translate to write this. I apologize if there are any errors!
One of the most common reasons that you might not see the SLA tab in Explore is that you haven’t created any SLAs on your tickets yet. Once you have active SLAs, the tab should show up in Explore within an hour or so.
Please let me know if this isn’t the problem and I’ll open a ticket on your behalf.
Thanks!)
Hi. My question is that the Total Created tickets is not equal to the sum of Solved tickets and Unsolved tickets. I would appreciate some explanation on how to interpret this data for the rest of my team.

Thank you.
Hi Vovwe Muoghereh,
What's happening here is you're looking at a snapshot in time (9/17-12/15). You have 827 solved tickets in that timeframe and 7 that are unsolved. This wouldn't be expected to match the total created tickets because some might have been solved or open prior to 9/17 or after 12/15....
Thanks for the explanation Heather.
Please sign in to leave a comment.