Summary: ◀▼
The access log tracks agent and admin activity on tickets, user profiles, and searches within the last 90 days, helping you monitor data access and detect security risks. You can view, filter, and export logs via the Admin Center or API, and generate AI descriptions for easier event understanding. This tool supports compliance and oversight by showing who accessed what and when in your account.
The access log, part of the Advanced Data Privacy and Protection add-on, is a powerful tool that enhances data security and administrative control of your account. It's a record of access events for your account related to tickets, user profiles, and searches. This differs from the audit log, which provides a detailed log of changes to settings or fields.
The access log is currently available as an API and in Admin Center, and captures what data an agent or admin has accessed in your account within the last 90 days. It doesn't capture end-user activity.
Access logs can help you answer the following questions:
- What tickets are agents accessing?
- What information are agents searching for?
- What user profiles are agents viewing?
Admins and agents with permission can view the access log. See Access logs use cases and workflows for examples of how to use the access log to detect security risks and help ensure compliance.
Turning on the access log
Before you can view access logs, you must turn on the Access Log API in Admin Center. When you do, Zendesk begins capturing access events. Access events that occurred before you turned on the API aren't captured.
Only admins can turn on the access log. After you turn it on, data may take up to 60 minutes to populate.
To turn on the access log
- In Admin Center, click
 Account in the sidebar, then select Logs > Access log.
 - Select Turn on the Access Log API.
- Click Save.
Viewing the access log in Admin Center
The Access log page in Admin Center lets you view a detailed list of access events in your account. You must first turn on the access log before viewing it in Admin Center.
-
In Admin Center, click
Account in the sidebar, then select Logs > Access log.
The Access logs page appears.
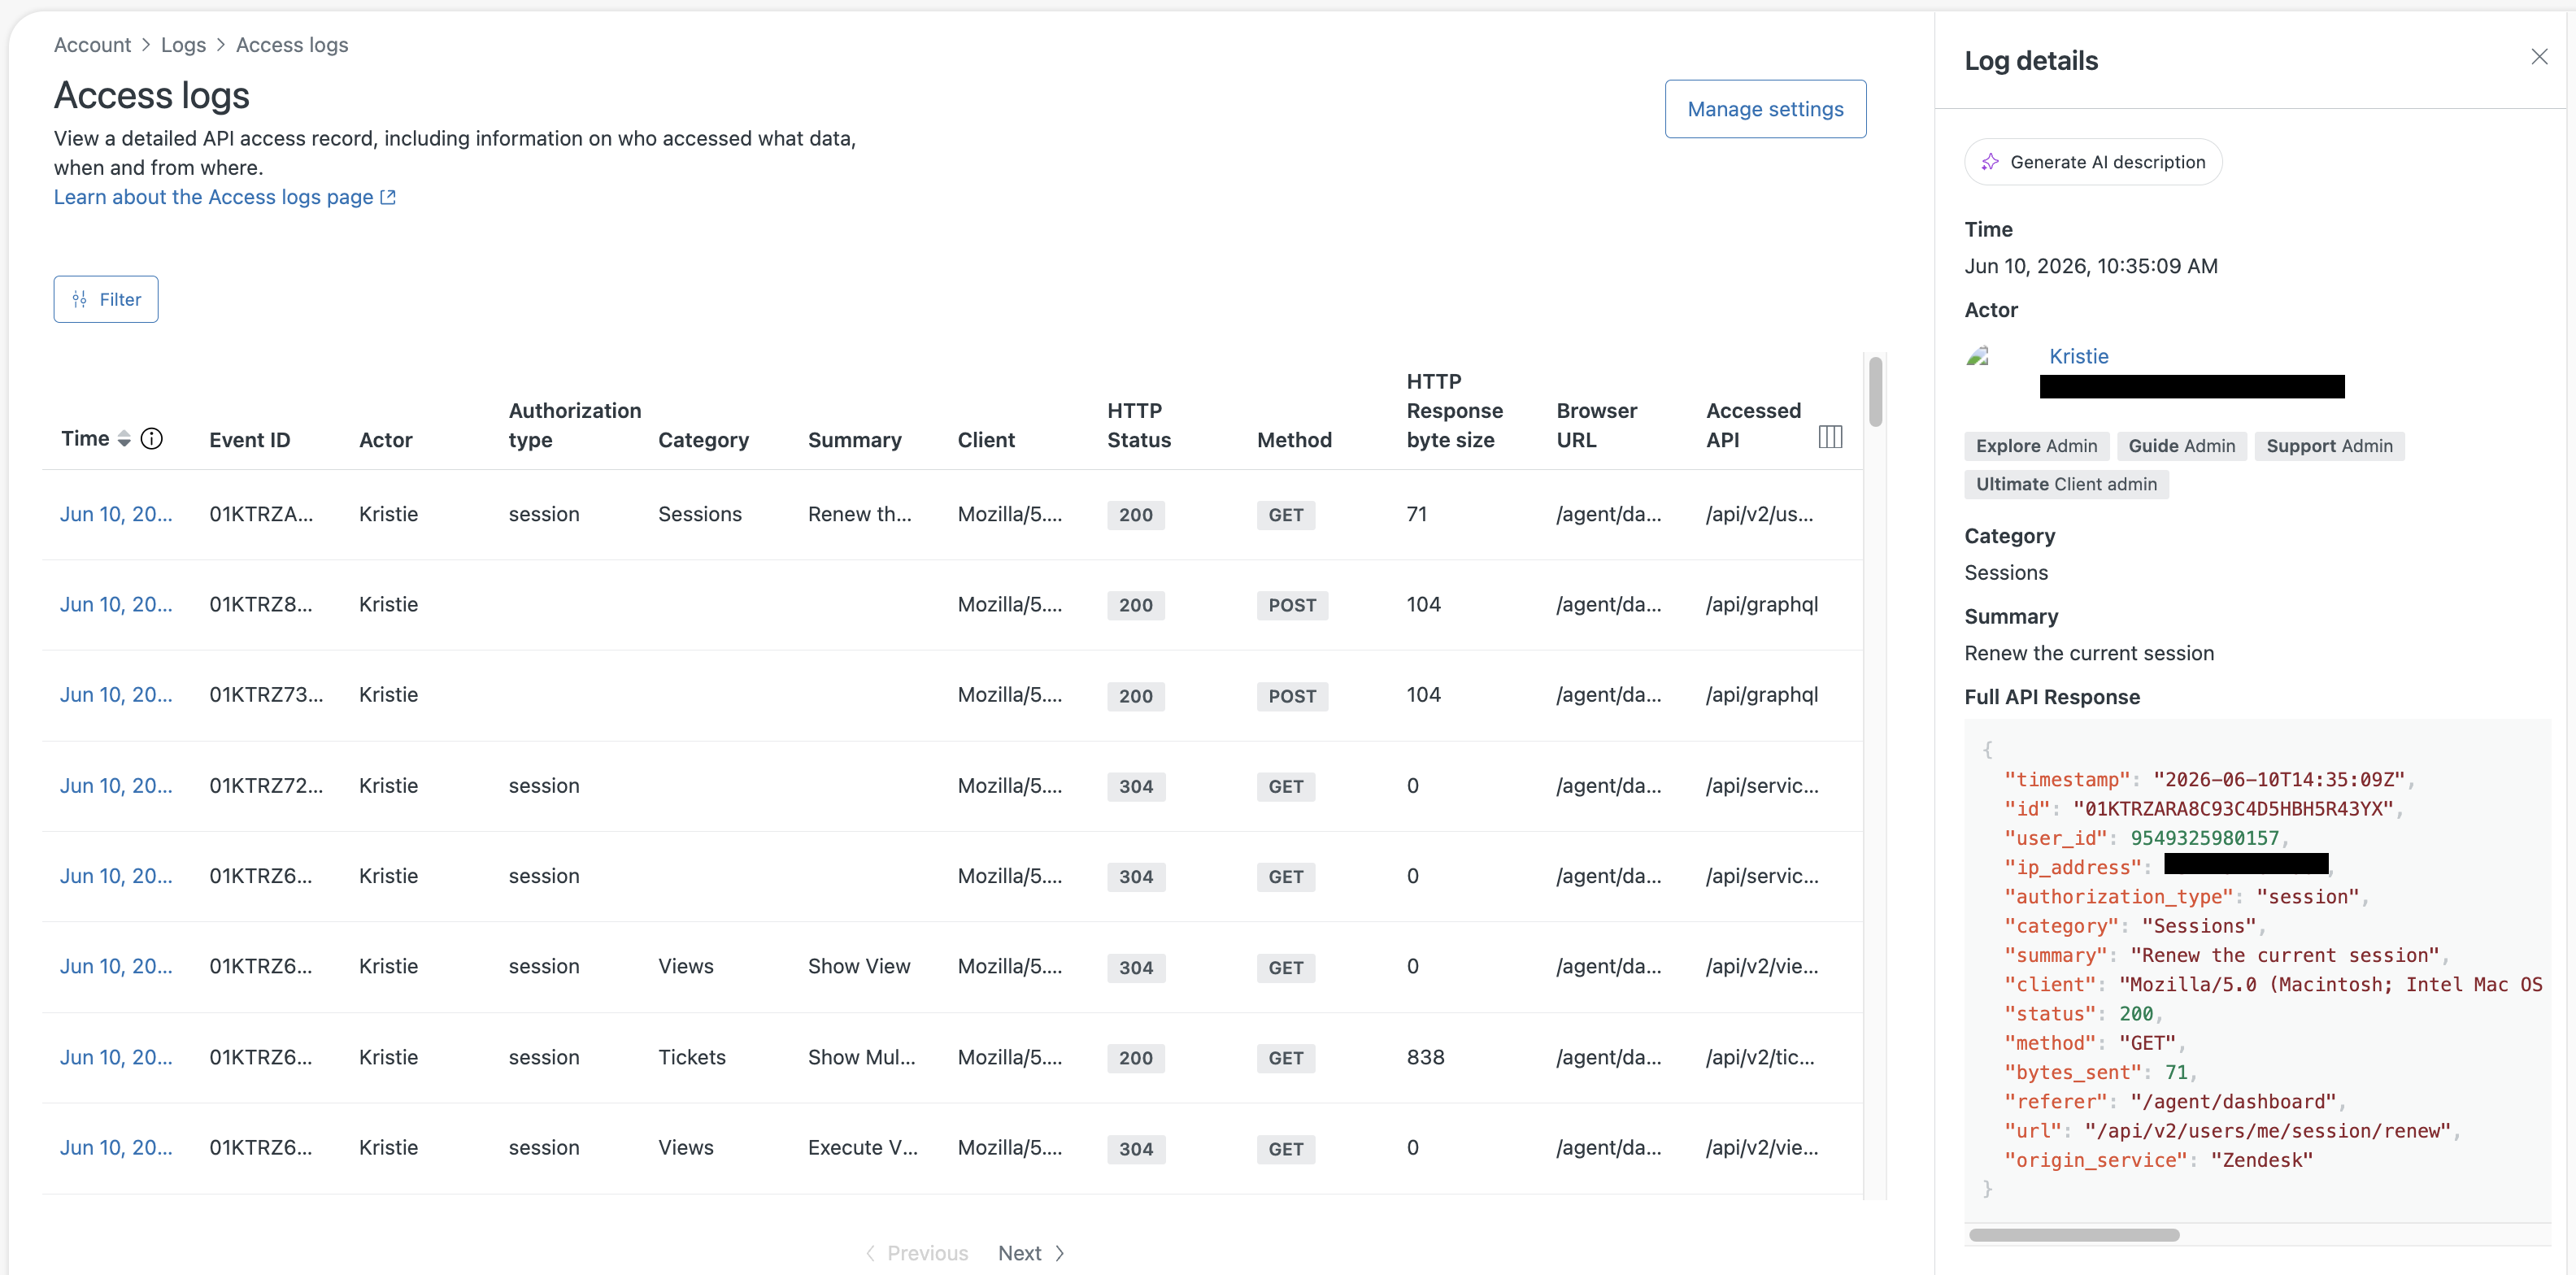
Each row in the access log represents a single access event by an agent or admin in your Zendesk account. Log entries are sorted by time (newest entry first). Click an event to display its details in the right panel. From the right panel, you can review the event and generate an AI analysis.
Use the Show and hide columns menu icon (![]() ) in the upper-right corner of the
table to adjust the columns that are visible in the log.
) in the upper-right corner of the
table to adjust the columns that are visible in the log.

The following information appears for each event in the access log.
| Column | Description |
|---|---|
| Time | The time and date when the page or record was accessed, displayed in your account's time zone. If you're unsure what time the access log is using, hover over the information icon in the Time column heading. |
| Event ID | The unique ID for the access event. |
| Actor | The team member or user who accessed the page or record in Zendesk. This helps track which users are interacting with a specific account. |
| IP address | The IP address of the user who made the request. |
| Authorization type | The method used for user authorization. Examples: Basic, Session, Digest, Bearer |
| Client | The client software that is initiating the request. Example: a web browser |
| Category | The type or classification of access that occurred, related to
the performed operation or API call, such as Users, Profiles API, or
Phone numbers. This helps identify the function or system component
involved. Some access events don't have an associated category, so this field may be empty. |
| Summary | A brief and easy-to-understand description of the access event,
related to the performed operation or API call, such as Show user,
Get profile by identifier, or List phone numbers. Summarizes the
purpose of the access entry. Some access events don't have an associated summary, so this field may be empty. |
| HTTP Status | The HTTP status code of the response. |
| Method | The HTTP method of the request. Possible values are GET, POST, PUT, and DELETE. |
| HTTP Response byte size | The total amount of data, measured in bytes, sent as part of the HTTP response. |
| Browser URL | The specific URL that the agent accessed when performing the
operation. The Browser URL might not indicate the operation that was performed. The field is empty when a direct API call is performed. |
| Accessed API | The API called to perform the specific operation. |
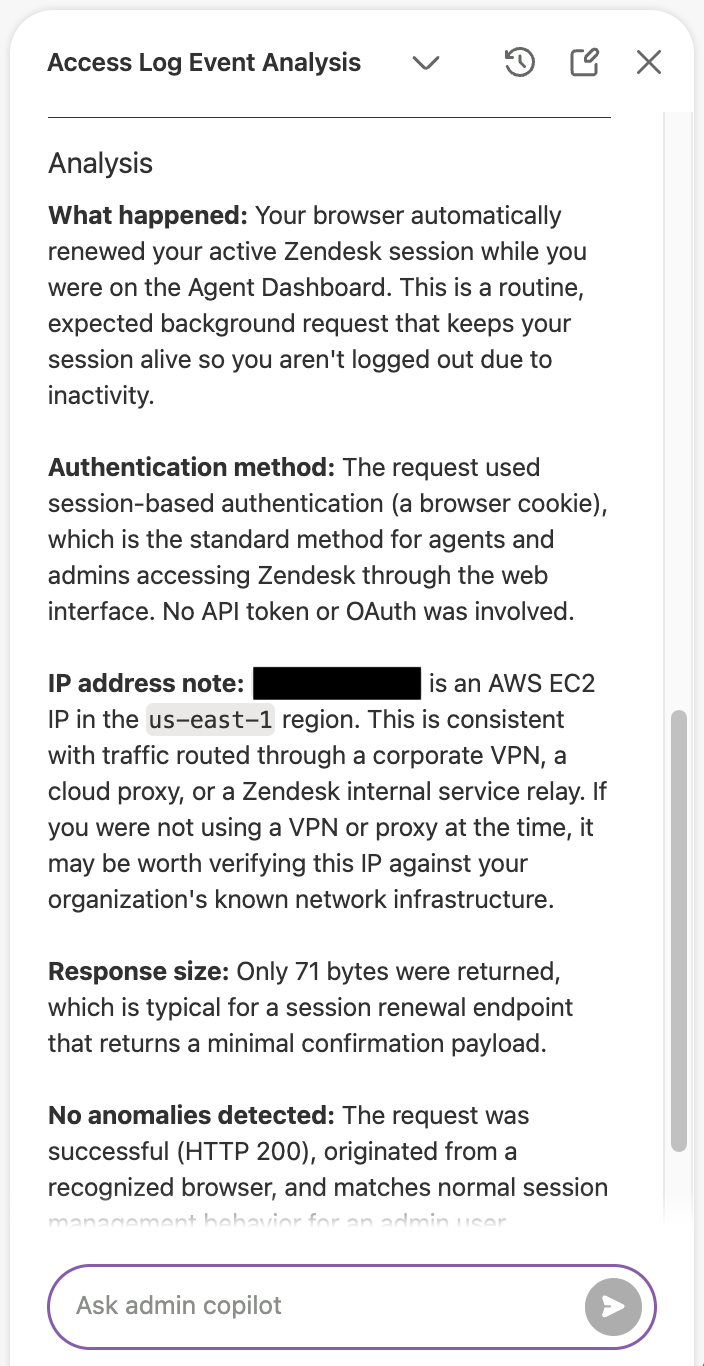
Generating an AI description for an access log event
You can use AI to describe and analyze an access log event using language that’s easier to understand. This helps less technical users figure out what happened in a log event, why it might matter, and what to check next.
You must have admin copilot conversational assistance turned on to view AI summaries.
To generate an AI description for an access log event
- In Admin Center, click
Account in the sidebar, then select Logs > Access log.
- Locate and click the event you'd like to generate a description for.
Event details appear in the right panel.
- Click Generate AI description.
Admin copilot opens with a description and analysis of the event.
Filtering access log data to refine search results
Since the access log can include a large volume of events, filtering makes it easier to find what you’re looking for.
To filter the access log
- In Admin Center, click
Account in the sidebar, then select Logs > Access log.
- Click Filter.
Filters appear in a panel.
- To filter by date, set the fields Start date, Start time, End
date, and End time.
The default date reflects the maximum number of days the log can capture data (90 days). The time reflects the local time for your account in your localization settings.
- Enter a name or email address in the Actor field to filter by the people or systems responsible for the access events.
- Apply an activity filter for a more refined search:
-
Category: Type or select a category to filter events by type
(such as Users, Permissions, or Tickets). The drop-down shows a limited
number of categories and displays suggestions after typing three
characters.
After you select a category, you can narrow your results by selecting one or more items from the Summary drop-down list. For example, if you selected the Users category, you can add the Show User and Update User summary items to display only those access events.
-
Accessed API: Use this field to filter by the accessed API
endpoint path. Example:
/api/v2/users/6649960843290/related.json - GraphQL logs: Select this option to exclude GraphQL logs, which track Zendesk component interactions, from the results. Applying this filter removes these events from the access log to reduce noise, without stopping event collection or storage, or impacting access log API endpoints.
-
Category: Type or select a category to filter events by type
(such as Users, Permissions, or Tickets). The drop-down shows a limited
number of categories and displays suggestions after typing three
characters.
- Click Apply filters.
Using the API to export access logs
Use the Access Logs API to export access logs to a CSV file. The API lets you filter the logs using the same filters as the Admin Center user interface, as described in Filtering the data to refine search results. You can also use scripting to filter the returned data.
You’ll need to work with a developer or other technical resource at your company to export the data. See Exporting access logs to a CSV file and Zendesk API Reference: Access Logs.