Verified AI summary ◀▼
Explore's prebuilt dashboard helps you analyze agent performance and customer satisfaction across messaging channels. It offers insights into ticket resolution times, goal conversions, and more. Customize reports to track metrics like reply times and unsolved tickets, and assess agent activity and goal conversions. Use this tool to make informed decisions and enhance your support operations.
Zendesk Explore features a prebuilt dashboard to help you monitor your agent performance and customer satisfaction across all messaging channels, including web, mobile, and social messaging channels. The Messaging dashboard can help you analyze information about the number of messaging tickets, resolution times, goal conversions, and more.
This article contains the following topics:
Accessing the Zendesk Messaging dashboard
Use the following procedure to access the Zendesk Messaging dashboard.
To access the dashboard
- In Explore, click the
Dashboard
icon (
 ).
). - From the list of dashboards, click the Zendesk Messaging dashboard.
Understanding the Zendesk Messaging dashboard reports
The Zendesk Messaging dashboard contains the following tabs:
- Overview tab
- Efficiency tab
- Assignee activity tab
- Unsolved tickets tab
- First reply time tab
- Goal conversions tab
All reports in this dashboard use the Zendesk Chat > Messaging tickets dataset. For details about the dataset, see Metrics and attributes for Zendesk messaging.
Overview tab
The Overview dashboard shows information about the number of messaging tickets, resolution times, satisfaction, and more. You can filter the reports by time, ticket group, ticket brand, ticket channel, and ticket priority.
To open the Overview dashboard tab
- In Explore, click the
Dashboard
icon (
).
- From the list of dashboards, click the Zendesk Messaging dashboard.
- Click the Overview tab.
Overview tab headline metrics
This tab displays the following headline metrics (KPIs) for the time range you specify:
- Messaging tickets: The total number of messaging tickets created.
- Outside business hours: The number of messaging tickets that were created outside your business hours (determined by the schedule that was assigned at the time of ticket creation).
- Solved tickets: The number of messaging tickets created that are in the Closed and Solved statuses.
- One-touch tickets: The percentage of messaging tickets that were solved in the first interaction, determined by transitioning from Open to Solved, without going through Pending or On-hold.
- Full resolution time: The median time between when a ticket was created and when it was last resolved.
- Satisfaction score: The percentage of messaging tickets rated as good from the total number of rated tickets.

Overview tab reports
This tab displays the following reports for the time range and data filters you specify:
-
Messaging tickets created by hour: The percentage of messaging tickets that were created
during each hour of the day, on average.

-
Average messaging tickets created by weekday: The number of messaging tickets that were
created during each weekday, on average.

-
Messaging tickets created by date: The number of messaging tickets created during the
last month, including the proportion of those that were
solved.

-
Messaging tickets by selected attributes (top 10): The percentage of messaging tickets
split by the values of the following attributes: Ticket
brand, Ticket channel, Ticket group, and Ticket priority.
If an attribute has more than 10 possible values, only the
top 10 are shown.

-
Messaging tickets created by month/year: The number of messaging tickets created during
each month, with different years broken out into different
lines on the graph.

Efficiency tab
The Efficiency dashboard shows information about how quickly your agents reply to and resolve messaging tickets from customers. You can filter the reports by time, ticket group, ticket brand, ticket channel, and ticket priority.
To open the Efficiency dashboard tab
- In Explore, click the
Dashboard
icon (
).
- From the list of dashboards, click the Zendesk Messaging dashboard.
- Click the Efficiency tab.
Efficiency tab headline metrics
This tab displays the following headline metrics (KPIs) for the time range you specify:
- First reply time: The median time between when a messaging ticket was first created and when an agent first replied.
- First assignment time: The median time between when a messaging ticket was created and the first time it was assigned to an agent.
- Assignment to first reply: The median time between when a messaging ticket was last assigned to an agent and when the agent first replied.
- Requester wait time average: The median time that it took for an agent to reply to an end user
- Full resolution time: The median time between when a messaging ticket was created and when it was last resolved.
- Handle time: The median time that the agent spent interacting with the end user on the messaging ticket.

Efficiency tab reports
This tab displays the following reports for the time range and data filters you specify:
-
First reply time brackets: The percentage of messaging tickets that had a first reply
within each of the predefined time brackets.

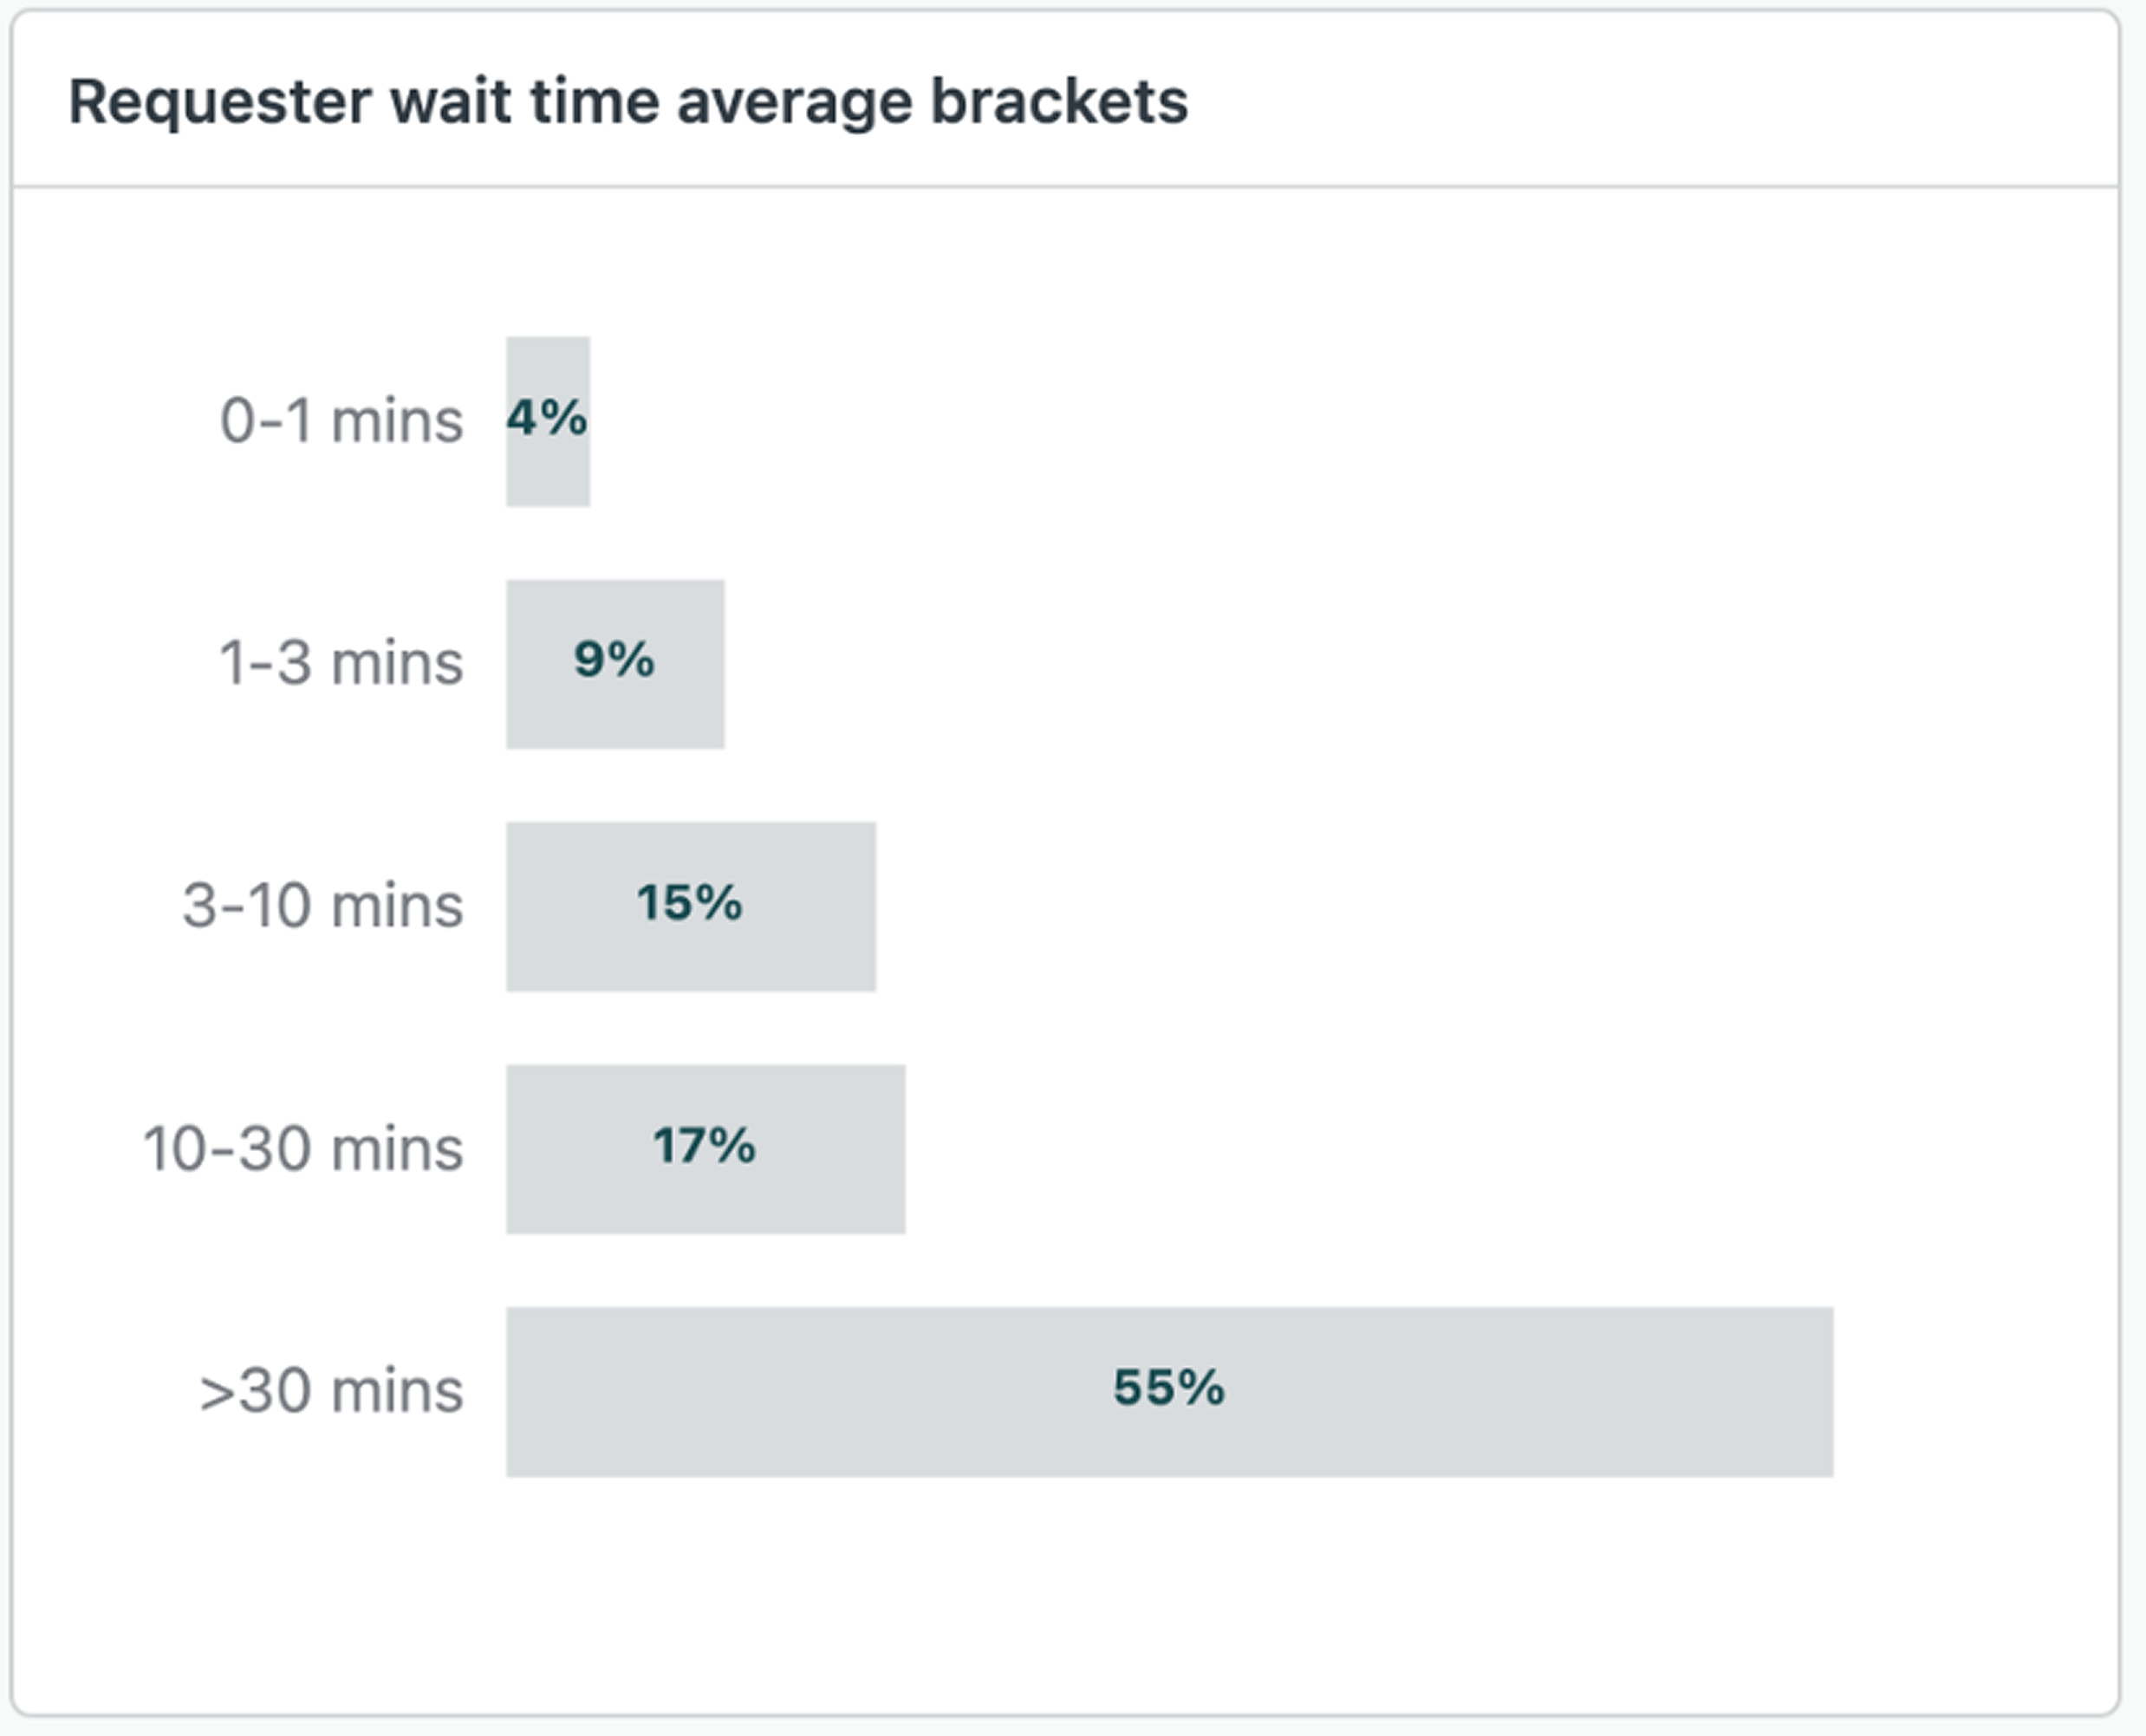
-
Requester wait time average brackets: The percentage of messaging tickets for which the
requesters' average wait time for an agent response falls
within each of the predefined brackets, shown as a column
graph.
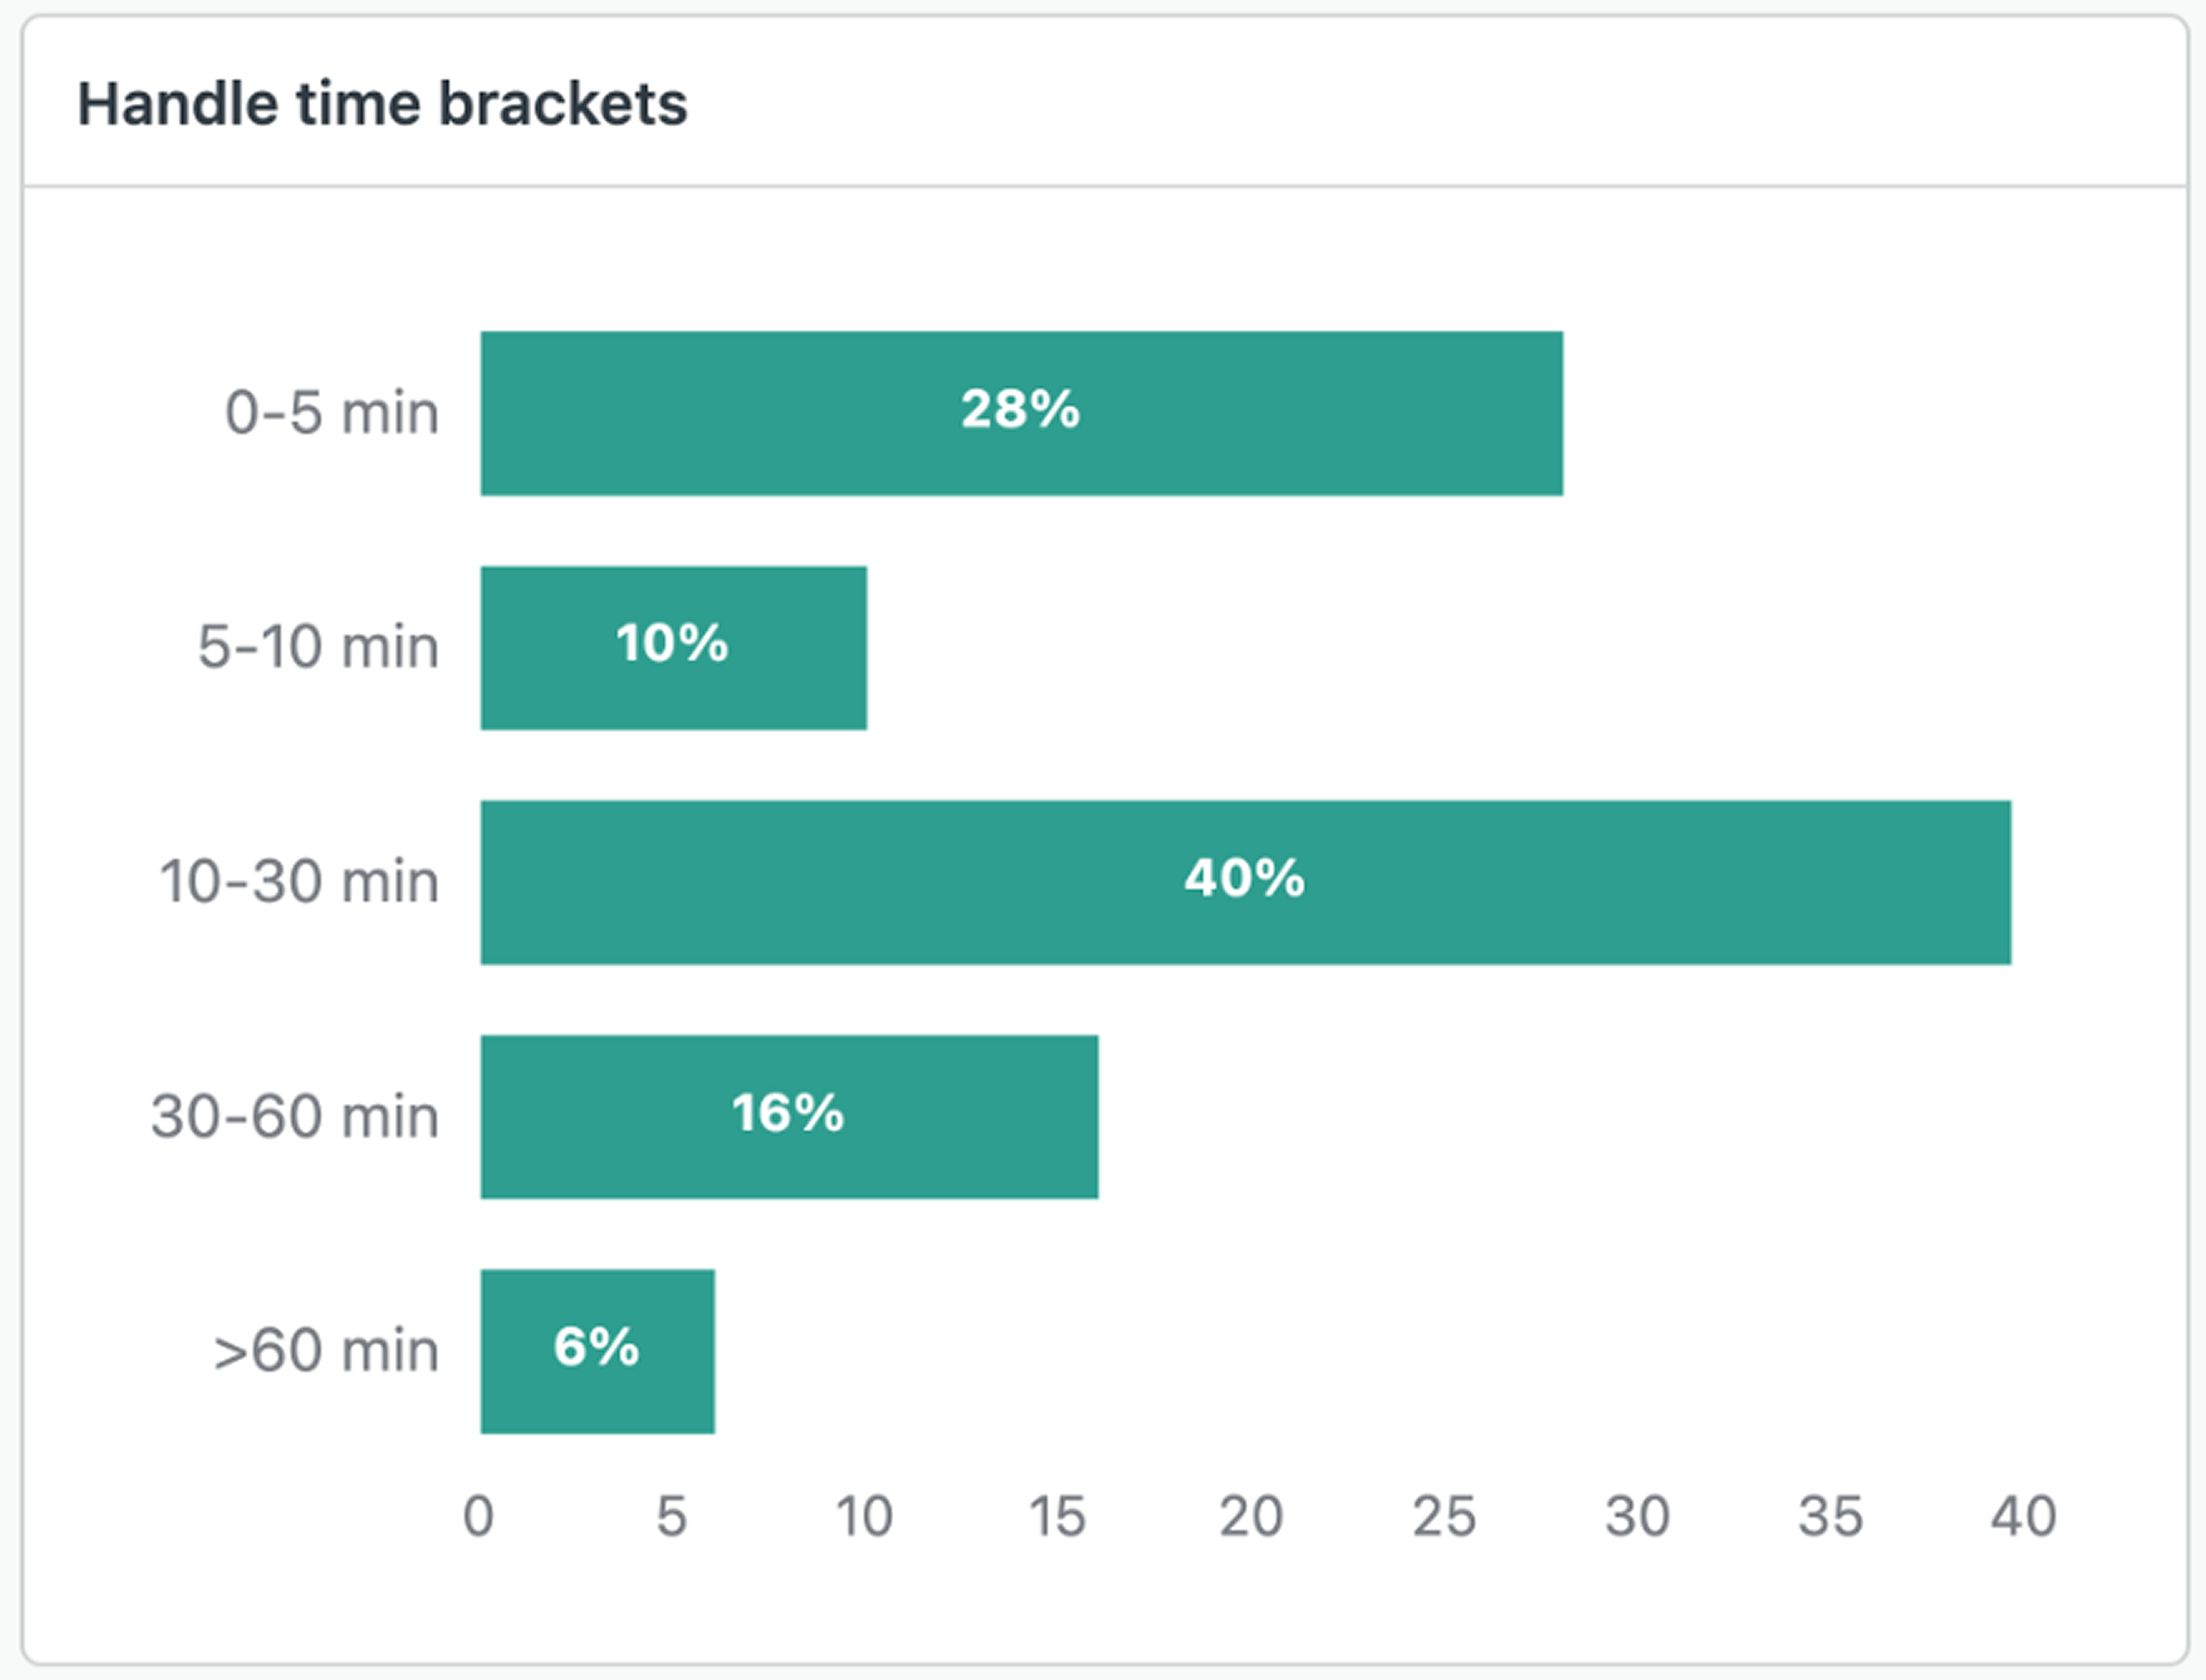
-
Handle time brackets: The percentage of messaging tickets for which the median time the
agent spent interacting with the end user falls
within each of the predefined time brackets.
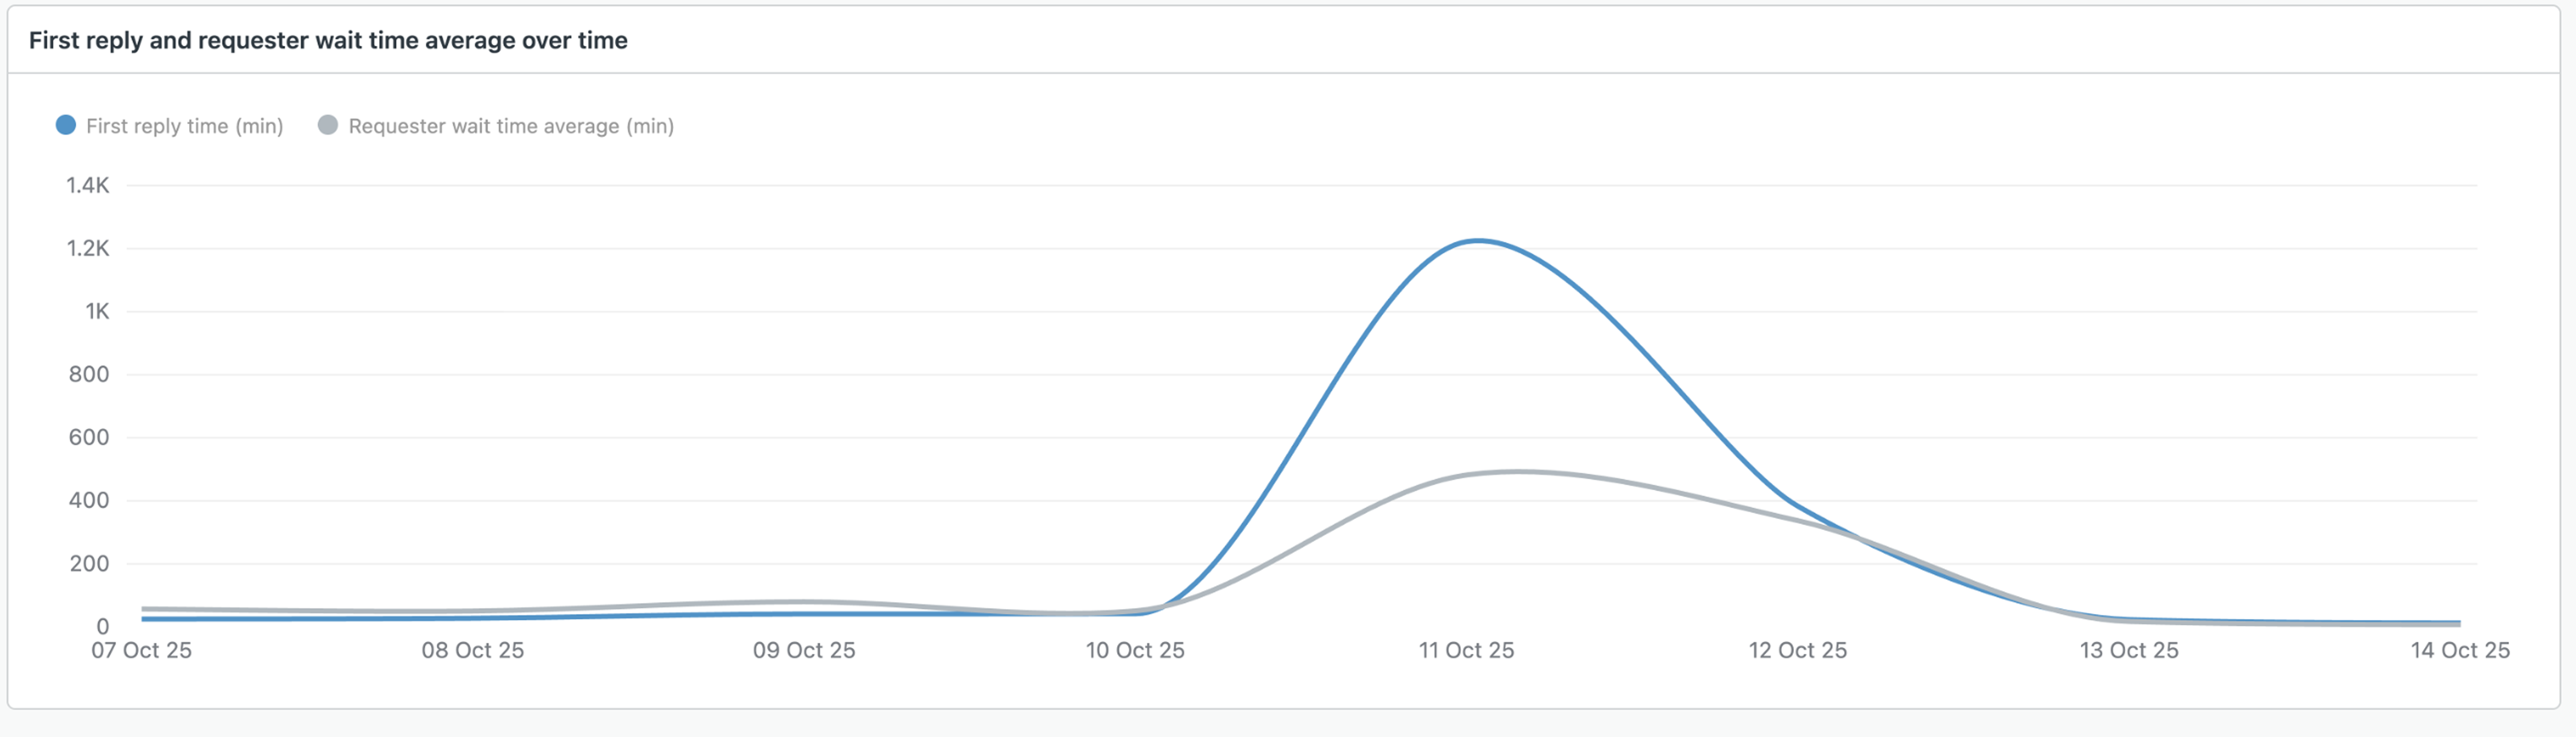
-
First reply and requester wait time average over time: The daily median number of minutes
it took for an agent to initially reply to an end
user and the average number of minutes it took for
a agents to respond to the end user, shown as two
separate lines on the graph.
-
Full resolution time brackets: The median time between when a messaging ticket was
created and when it was las resolved, shown as a pie
chart.
-
Resolution funnel: The progression of messaging tickets from open
to solved. This report also shows reopened messaging tickets.

Assignee activity tab
The Assignee activity dashboard shows information about agent performance and includes reports on reply times, resolution times, number of one-touch tickets, satisfaction ratings, tickets solved, and more. You can filter the reports by time, ticket group, ticket brand, assignee name, ticket channel, and ticket priority.
To open the Assignee activity dashboard tab
- In Explore, click the
Dashboard
icon (
).
- From the list of dashboards, click the Zendesk Messaging dashboard.
- Click the Assignee activity tab.
Assignee activity tab headline metrics
This tab displays the following headline metrics (KPIs) for the time range you specify:
- Assignment to first reply: The median time between when a messaging ticket was first assigned to an agent and when the agent first replied.
- Median reply time: The median time that it took for an agent to reply to an end user.
- Median time to resolution: The median time between when a messaging ticket was created and when it was first resolved.
- Messaging tickets: The total number of messaging tickets created.
- One-touch tickets: The percentage of messaging tickets that were solved in the first interaction, determined by transitioning from Open to Solved, without going through Pending or On-hold.
- Reassigned tickets: The total number of messaging tickets that have been assigned to more than one agent.
- Session ended by agent: The total number of messaging tickets where the session was ended by the agent.

Assignee activity tab reports
This tab displays the following reports for the time range and data filters you specify:
-
Good vs. bad satisfaction tickets: The percentage of tickets with a satisfaction rating
of Good compared to the percentage of tickets with
a satisfaction rating of Bad.

-
Average reply time brackets: The percentage of messaging tickets for which the agent
median reply time falls within each of the predefined
brackets.
-
Satisfaction vs. median time to first resolution: The first resolution time and requester
wait time (the time it took for an agent to reply
to an end user) shown as two separate lines on the
graph, and the daily satisfaction score for each
of the predefined brackets.

-
Assignee activity: A table showing the ticket, satisfaction,
handle time, reply time, and resolution time metrics for each agent or
group.

Unsolved tickets tab
The Unsolved tickets dashboard shows information about your unsolved tickets, including how many are unreplied to, how old the tickets are, what status they’re in, who has the most unsolved tickets, and more. You can filter the reports by ticket group, ticket brand, ticket channel, and ticket priority.
To open the Unsolved tickets dashboard tab
- In Explore, click the
Dashboard
icon (
).
- From the list of dashboards, click the Zendesk Messaging dashboard.
- Click the Unsolved tickets tab.
Unsolved tickets tab headline metrics
This tab displays the following headline metrics (KPIs) for the time range you specify:
- Unsolved messaging tickets: The number of messaging tickets that are in the New, Open, Pending, or On-hold status.
- New and open tickets: The number of messaging tickets that are in the New or Open status.
- Unreplied unsolved tickets: The number of tickets that are in the New, Open, Pending, or On-hold status that don’t have an agent reply.
- Tickets age median: The median time since a ticket in the New, Open, Pending, or On-hold status was created.
- Routing channel changed unsolved tickets: The number of tickets in New, Open, Pending or On-hold status, where a messaging ticket was routed to another channel.

Unsolved tickets tab reports
This tab displays the following reports for the time range and data filters you specify:
-
Unsolved messaging ticket by status: The percentage of messaging tickets in the New,
Open, Pending, and On-hold statuses, broken out by ticket
status.

-
New and open messaging ticket by assignment status: The percentage of tickets in the New
and Open status that have been assigned compared to those
that have not been assigned.

-
Unsolved tickets by session ending reason: The percentage of messaging tickets in the
New, Open, Pending, and On-hold statuses, broken out by
messaging session ended reason: Agent ended the session,
Session ended by trigger, or Session ended due to channel
change.
-
Unsolved messaging tickets by selected attributes: The percentage
of messaging tickets in each ticket status, split by the values of the
following attributes: Ticket brand, Ticket channel, Ticket group, and
Ticket priority. If an attribute has more than 10 possible values, only
the top 10 are shown.

-
Unsolved messaging tickets created by month: The number of
messaging tickets in the New, Open, Pending, and On-hold statuses that
were created each month.

-
Unsolved messaging tickets: The number of messaging tickets in
the New, Open, Pending, and On-hold statuses and the median age of those
tickets assigned to each agent or group.

First reply time tab
The First reply time dashboard helps you report on first reply times and provides insights to improve your customer experience. It provides drill-down information into how long it took for agents to be offered, accept, be assigned, and reply to messaging tickets. You can filter the reports by date, ticket group, ticket brand, channel, and ticket priority.
To open the First reply time dashboard tab
- In Explore, click the
Dashboard
icon (
).
- From the list of dashboards, click the Zendesk Messaging dashboard.
- Click the First reply time tab.
First reply time tab headline metrics
This tab displays the following headline metrics (KPIs) for the time range you specify:
- First reply time: The median time, in minutes, from ticket creation to the first agent reply, excluding out-of-business hours.
- First offer time: The median time, in seconds, from ticket creation to the first time it was offered to an agent, excluding out-of-business hours.
- First offer to assignment: The median time spent in an offer state, in seconds, between first offer and first assignment to an agent, excluding out-of-business hours.
- Assignment to first reply: The median time between the last assignment to an agent and the first reply from that agent, excluding out-of-business hours.
- Offers: The number of times a messaging ticket was offered to agents during its lifecycle.
- Tickets with multiple offers: The number of messaging tickets that were offered to an agent, not accepted, and re-offered to other agents.
- % Acceptance rate: The percentage of acceptance of all offers on the ticket. One hundred percent indicates the ticket was accepted by all the agents it was offered to.
- Queue entries: The number of times the ticket was placed in the queue. A ticket is in the queue when it’s in a status of New or Open and unassigned.
- Offers before first accept: The number of times a messaging ticket was offered to agents before first acceptance.
- % First acceptance rate: The percentage of acceptance of first offers on the ticket. One hundred percent indicates the ticket was accepted by the first agent it was offered to.


First reply time tab reports
This tab displays the following reports for the time range and data filters you specify:
-
First reply time drill down - Business hours (min): The first
reply time broken down by first offer time, first offer to assignment
time, and assignment to first reply time.

-
First reply time median by month in business
hours: The first reply time history over 12
months, broken down by first offer time, first
offer to assignment time, assignment to first
reply time, and first reply time.

-
Group activity (First reply time drill down): A table summarizing important metrics (like
first reply, first offer to assignment, and
acceptance rates) for each ticket group.
Goal conversions tab
The Goal conversions tab can help you determine whether your agents are meeting conversion goals through their messaging conversations, how satisfied users are with those interactions, and more. You can filter most metrics and reports by time, specific goal name, ticket group, and assignee name.
Consider the following when using the Goal conversions dashboard:
- The dashboard displays information about active messaging goals with at least one successful conversion; inactive messaging goals, and goals that have not been met, are not included in the dashboard metrics.
- Deleted goals are not included in the data set.
- Goal attribution (who gets credit for the conversion) is currently based on the assignee, which is different than the live chat implementation. See Tracking customer actions with messaging goals for more information on goal attribution.
To open the Goal conversions tab
- In Explore, click the Dashboard icon ( ).
- From the list of dashboards, click the Zendesk Messaging dashboard.
- Click the Goal conversions tab.
Goal conversions tab headline metrics
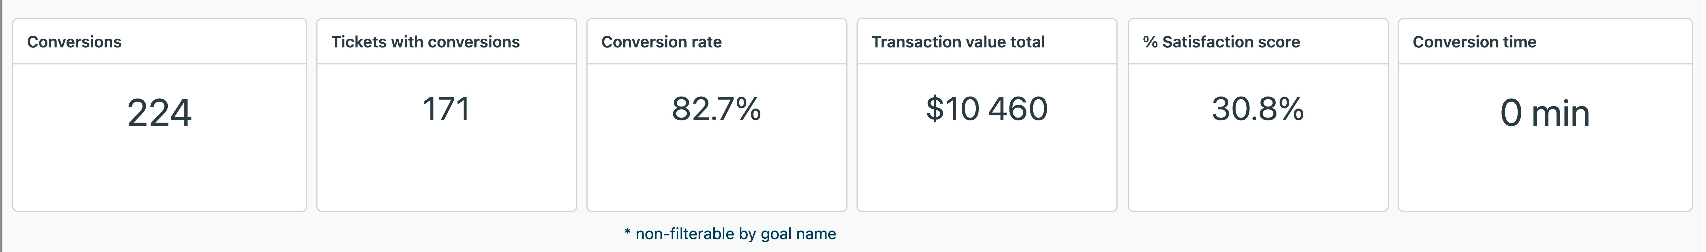
This tab displays the following headline metrics (KPIs) for the time range you specify:
- Conversions: Total number of goal conversions.
- Tickets with conversions: Number of tickets with goal conversions. Tickets can have multiple goal conversions.
- Conversion rate: The percentage of messaging tickets with goal conversions. This metric is not filterable by goal name.
- Transaction value total: Total transaction value from goal conversions.
- % Satisfaction score: Percentage of satisfaction surveys rated Good for tickets with goal conversions.
- Conversion time: Average number (in minutes) from ticket creation to first goal conversion.
Goal conversions tab reports
This tab displays the following reports for the time range and data filters you specify:
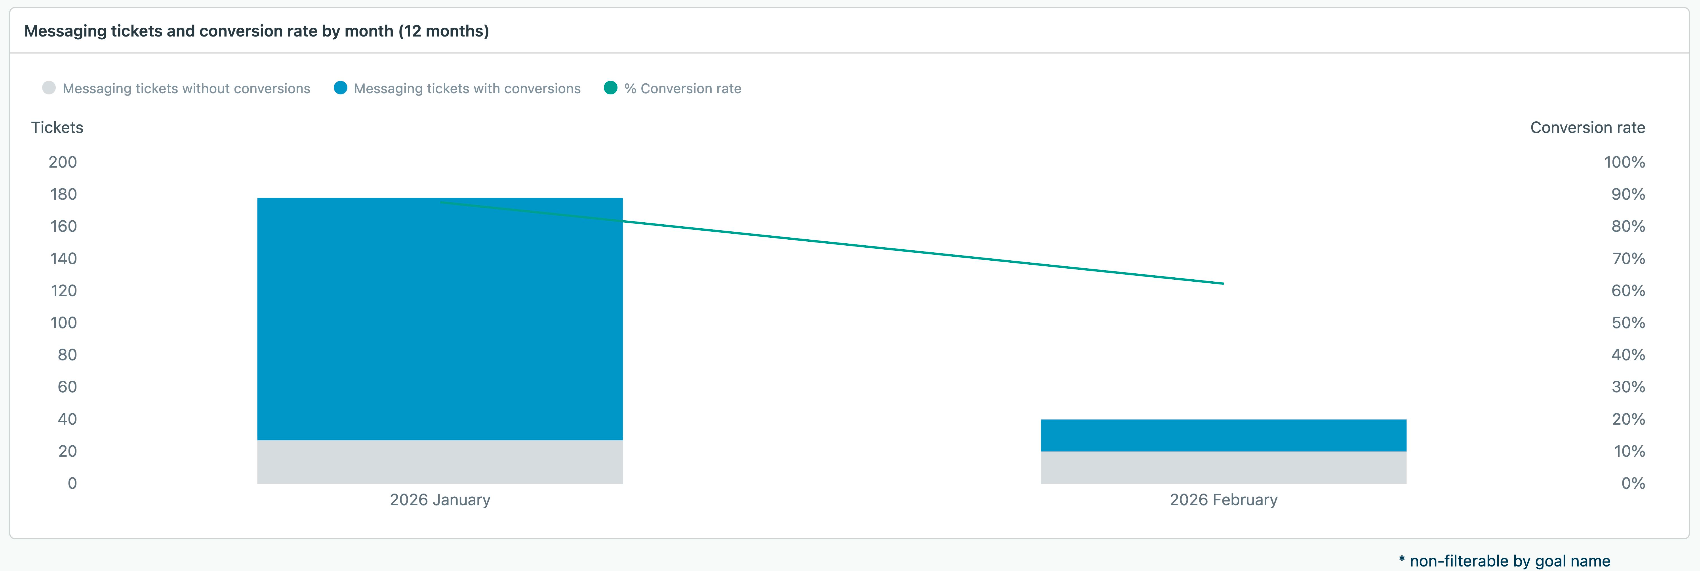
-
Messaging tickets and conversion rate by month (12
months): The Messaging tickets and conversion
rate by month report provides a monthly breakdown of the
total messaging tickets – with and without conversions. It
covers the most recent 12-month period.
This report is not filterable by goal name
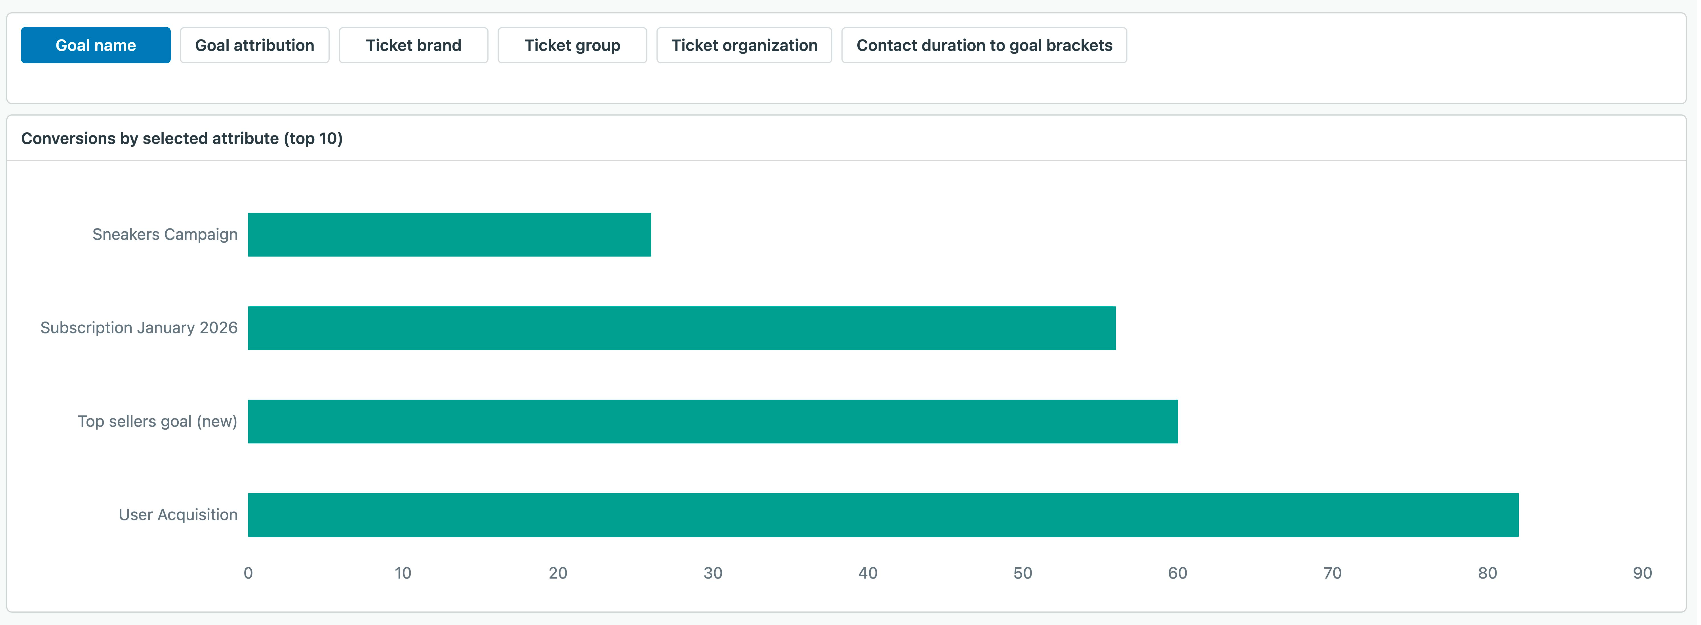
- .Conversions by selected attribute (top 10):
The number of goal conversions split by the values
of the following attributes: Goal brand, Goal
attribution, Ticket brand, Ticket group, Ticket
organization, and Conversion time brackets. If an
attribute has more than 10 possible values, only the
top 10 are shown.
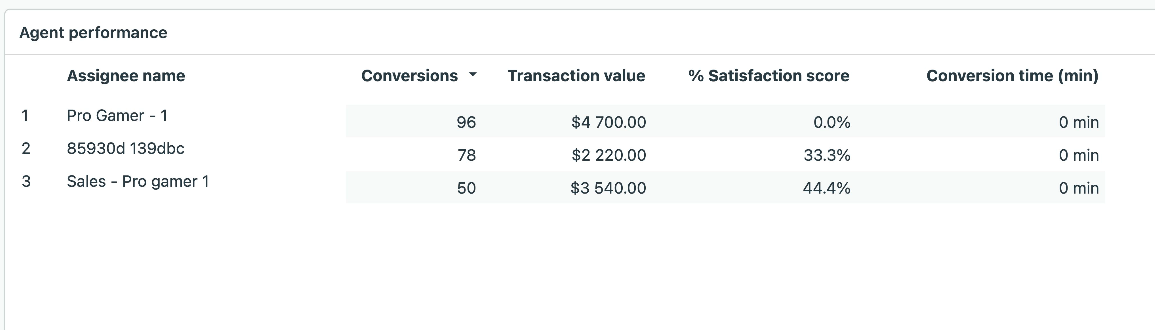
-
Agent performance: The number of goal
conversions attributed to each agent. This report
highlights the effectiveness of individual agents in
achieving their assigned goal.
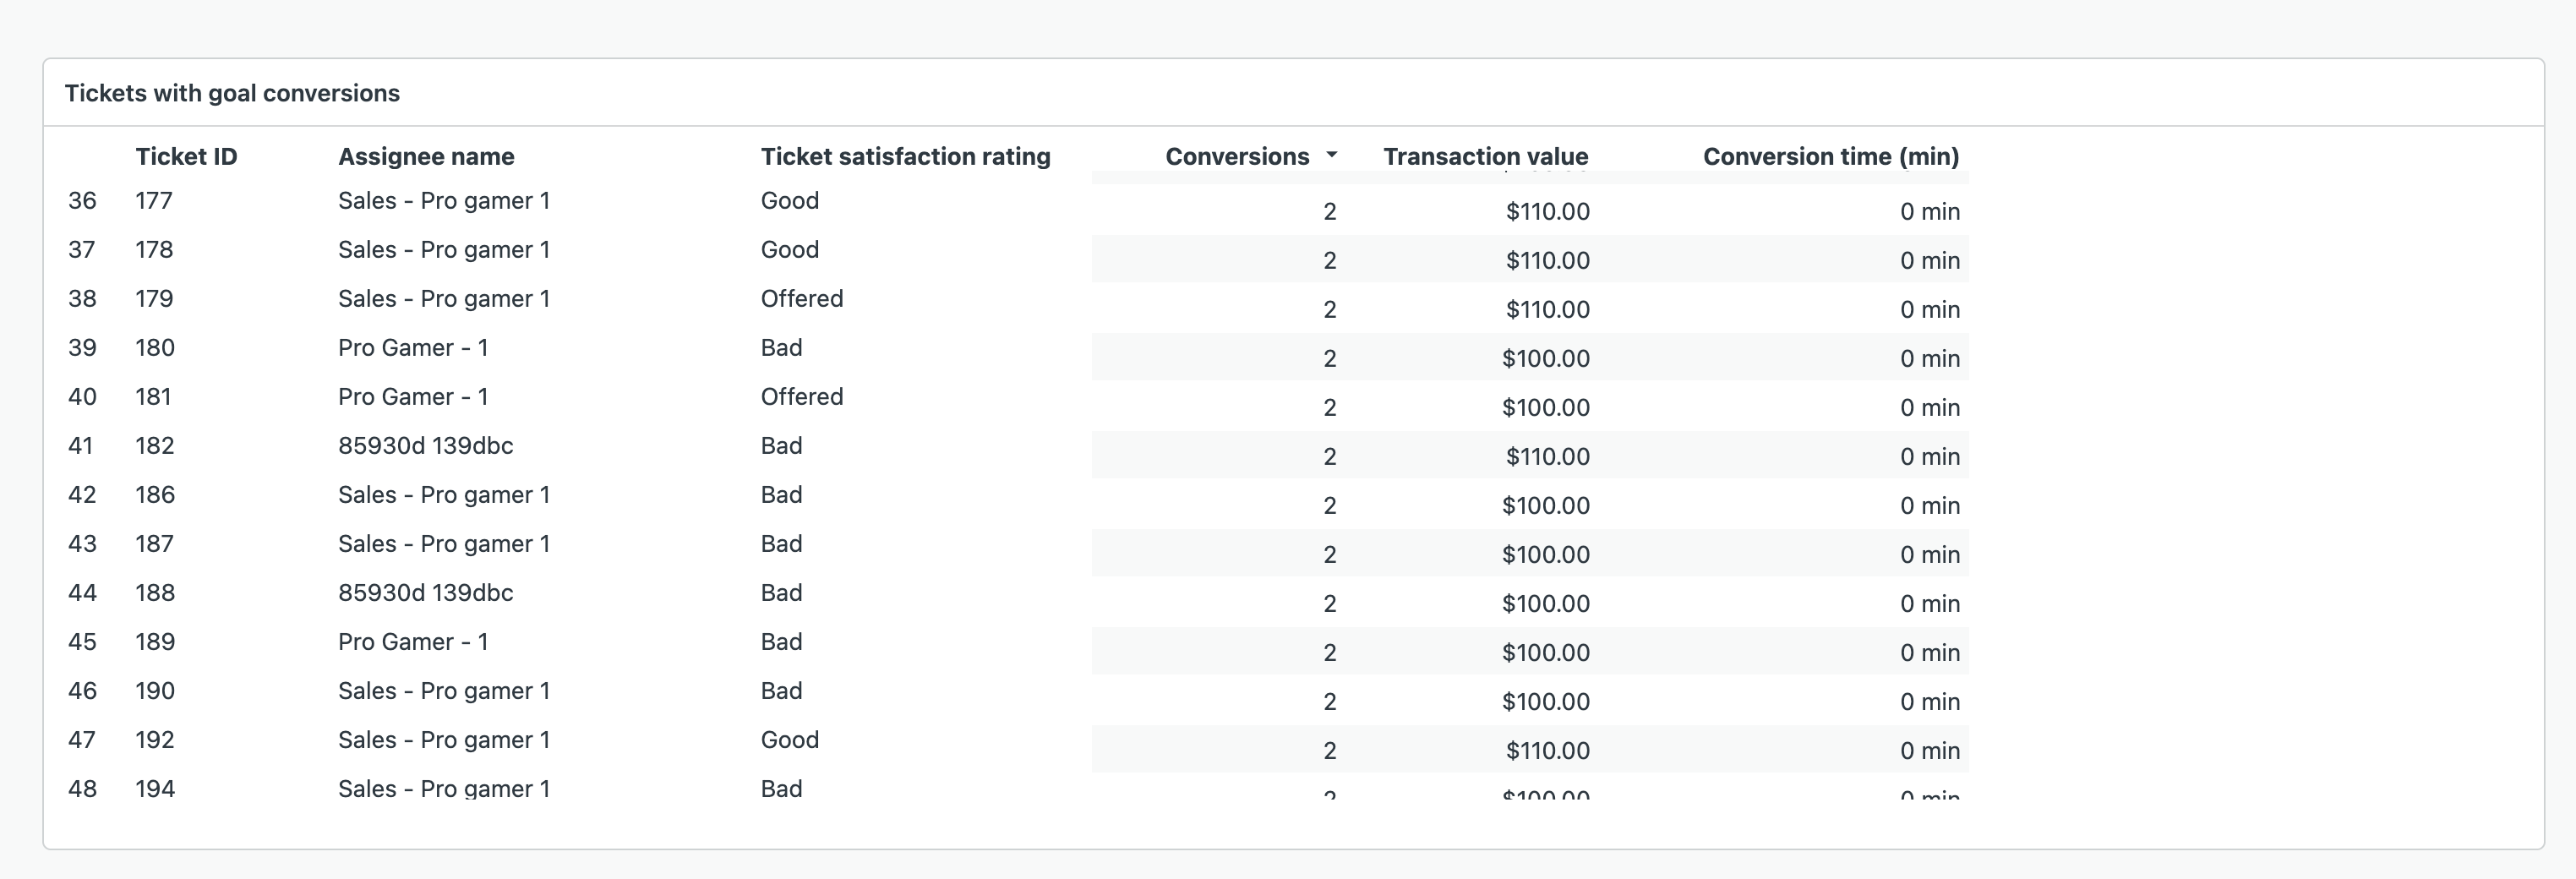
-
Tickets with goal conversions: Breaks down goal
conversion metrics by ticket This report helps in
identifying which tickets resulted in achieved
goals, facilitating analysis of ticket-specific
interactions.