Articles in the series
After you get the suite up and running, you’ll want to start finding out how well your support is functioning. Explore, the suite’s built-in reporting feature, is the primary tool you’ll use to examine your support activity across all channels.
The combination of reports you can view or create is almost endless, but some examples include viewing:
- Created tickets, open tickets, and solved tickets
- Help center page views
- The number of calls that were not answered
- Information about your usage of Zendesk Messaging
This article contains the following sections:
Using built-in reports
The suite includes many prebuilt reports you can use to monitor activity across all your channels. These reports appear in dashboards that you can share with others.
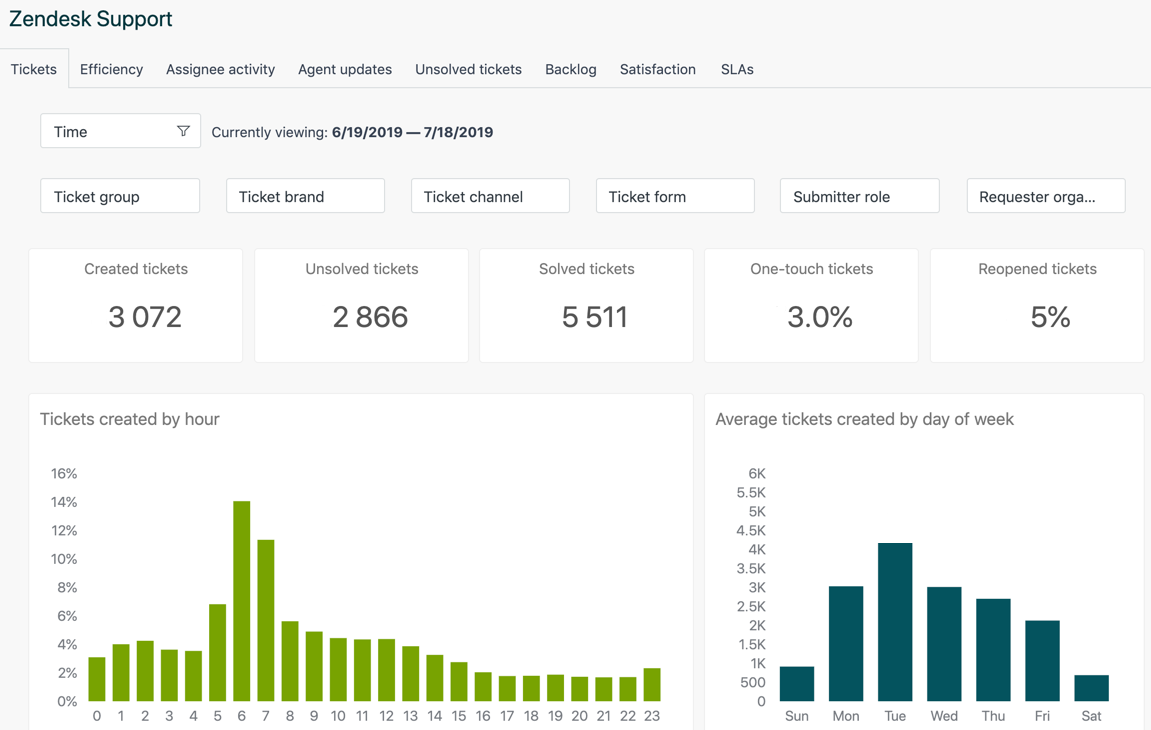
Here’s an example of the dashboard for ticketing:

Each dashboard contains many reports based on best practices for monitoring support activity and agent performance. You can filter these reports to refine your results. For example, the Support dashboard displays the number of tickets you’ve solved, but you can filter this by the channel that generated the ticket, the ticket group, and more.
There are dashboards for most suite features, and you can find more information in the following articles:
- Overview of the Zendesk Support dashboard
- Overview of the Zendesk Knowledge dashboard
- Overview of the Zendesk Talk dashboard
- Overview of the Zendesk Chat dashboard
- Overview of the Zendesk Messaging dashboard
- Overview of the Zendesk Answer Bot dashboard
- Overview of the Explore live dashboard
- Overview of the omnichannel routing queues live monitoring dashboard
- Overview of the Generative AI Agent Tools dashboard
- Overview of the Explore live performance data by channel dashboard
- Overview of the Intelligent triage dashboard
- Overview of the omnichannel agent state and activity dashboard
- Overview of the Zendesk Copilot: Agent productivity dashboard
See Viewing dashboards to learn more about opening and navigating the dashboards.
Creating your own reports
The prebuilt dashboards are great, but sometimes you need a report that isn’t available. When that happens, depending on your Explore plan level, you might be able to create it yourself.
Most reports in Explore comprise two elements:
- Metrics are quantifiable data that represent the things you want to measure. A report must always contain at least one metric. Examples include the number of tickets, number of updates, and number of comments.
- Attributes are qualitative data that “slice” your metric into groups defined by the attribute's values. Examples include dates, user groups, tags, and ticket subjects.
For some examples of metrics and attributes, see Metrics and attributes for Zendesk Support.
A basic report consists of adding metrics and attributes to your report to display the desired data.
To get you started, we have some great Explore recipes which are short tutorials designed to help you report on many common business scenarios.
You can modify any report you create. For example, you can change the chart style, filter it by date, return only top (or bottom) results, and much more.
Sometimes, you won’t find the metric or attribute you want. In that case, you might be able to build your own. For example, here’s a custom attribute that returns the tickets with the word “Tweet” in the subject line:
IF (CONTAINS([Ticket subject],"Tweet"))THEN [Ticket ID] ENDIF
There’s a lot more you can do with reports. To get started, see Understanding reports.
Other suite reporting features
While Explore is the primary method to generate reports, the suite also features other dashboards for reporting. These include:
- The Chat dashboard enables agents to configure their Chat settings, view relevant information, and access the Chat window.
- The Live calls dashboard enables team managers to see all ongoing calls, listen in on agent conversations, and barge in on calls when agents need support or escalation.
Continue to Part 10: Enabling customer satisfaction ratings.