You can edit and customize the dashboard by cloning it. If you need something more complex, you can create your own reports using a wide range of metrics and attributes.
The information in Explore dashboards is updated on a schedule. The schedule depends on which Explore plan you are using. See Data refresh intervals for Explore reporting.
For information about the Article Recommendations tab, see Analyzing article recommendations.
Accessing the Answer Bot dashboard
Use this procedure to open the Answer Bot dashboard.
- In Explore, click the
Dashboard
icon (
 ) in the left sidebar.
 - From the list of dashboards, select the Zendesk Answer Bot dashboard.
Understanding the Flow Builder Overview tab
The Flow Builder Overview tab shows information about your users’ engagement with the bot you've built with Flow Builder (also known as bot builder) and deployed across messaging channels. You can filter the reports on the dashboard by Time, Brand, Channel, and Language.
- In Explore, click the
Dashboard
icon (
) in the left sidebar.
- From the list of dashboards, select the Zendesk Answer Bot dashboard.
- Click the Flow Builder Overview tab.
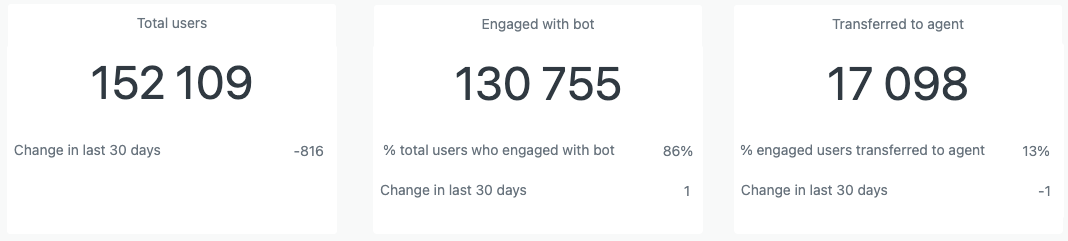
Flow Builder Overview tab headline metrics
- Total users: The number of unique users who received a message from the bot.
- Engaged with bot: The number of total users who actively participated in the conversation (for example, sent messages or selected options presented by the bot).
- Transferred to agent: The number of engaged users whose conversation was transferred from the bot to an agent. Also represents the number of tickets created.
Flow Builder Overview tab reports
-
Users by month: Shows the total users, engaged users, and
transferred users each month.

-
Top answers: Shows the answers that users engaged with, ranked in
descending order of count by default, along with the percentage of those
engaged users who then asked to be transferred to an agent.

-
Top selected options: Shows how many times each quick reply of
each answer has been selected by an end user, ranked in descending order
of count by default. If an answer or quick reply option is available in
multiple languages, or has had its wording updated since originally
released, those will show up as separate rows in this report.
Use this report to understand your customers’ most common inquiries or problem topics, and how they’re typically interacting with the bot. A limited number of rows are visible by default. To see more, you can scroll down in the table, expand the table to see more at once, or export the data into a CSV or Excel file to view it there.

-
Users by day of week or hour: Shows the total users, engaged
users, and transferred users each day. Clicking
Hour
toggles the
graph to show the same data for each hour of the day.

-
Users by brand or channel: Shows the total users, engaged users,
and transferred users by brand. Clicking
Channel
toggles the
graph to show the same data for each
messaging channel.

Understanding the Flow Builder Performance tab
The Flow Builder Performance tab shows information about bot and answer performance. This information gives admins the tools they need to measure and improve their bot automation performance. You can filter the reports by time, brand, channel, and language.
- In Explore, click the
Dashboard
icon (
) in the left sidebar.
- From the list of dashboards, select the Zendesk Answer Bot dashboard.
- Click the Flow Builder Performance tab.
Flow Builder Performance tab reports
This tab displays the following reports:
-
Containment rate: The percentage of conversations with engaged users
where the user was not transferred from the bot to an agent.

-
Responses received: The total number of times that a user responded
when asked for feedback by the bot, the total number of times that a bot
asked a user for feedback, and the percentage of instances where users
responded to a bot’s feedback request.

-
Resolved: The total number and the percentage of instances where
users who responded indicated that their issue was resolved.

-
Unresolved: The total number and the percentage of instances where
users who responded indicated that their issue was not resolved.

-
Top resolved answers: The answers with the highest proportion of
resolved responses from users.

-
Top unresolved answers: The answers with the highest proportion of
unresolved responses from users.

-
Resolution rate by month: The percentage of conversations with the
bot when a user’s issue was successfully resolved by the bot.
