If you've enabled the customer satisfaction (CSAT) survey, you can view details about your overall CSAT (customer satisfaction) results for all tickets on the Zendesk Support dashboard. You can view CSAT results for an individual in a ticket within Agent Workspace.
Viewing overall CSAT results in the Support dashboard
You can view details about your overall CSAT (customer satisfaction) results on the Satisfaction tab of the Zendesk Support dashboard in Explore.
Users with the Explore role of Admin or Editor can access the Support dashboard. If a user has the Explore role of Viewer, an Admin or Editor must share the dashboard with them before they can view it.
You must have received at least one response to view data in the dashboard (see Sending a CSAT survey to your customers).
- 1-2 rating scales: 1 is bad and 2 is good
- 1-3 rating scales: 1-2 is bad and 3 is good
- 1-5 rating scales: 1-3 is bad and 4-5 is good
To view CSAT results in the Support dashboard
- In Explore, click
the Dashboard icon (
) in the left sidebar.
- In the list of dashboards, select the Zendesk Support dashboard. The Zendesk Support dashboard opens.
- In the dashboard, click the Satisfaction tab.
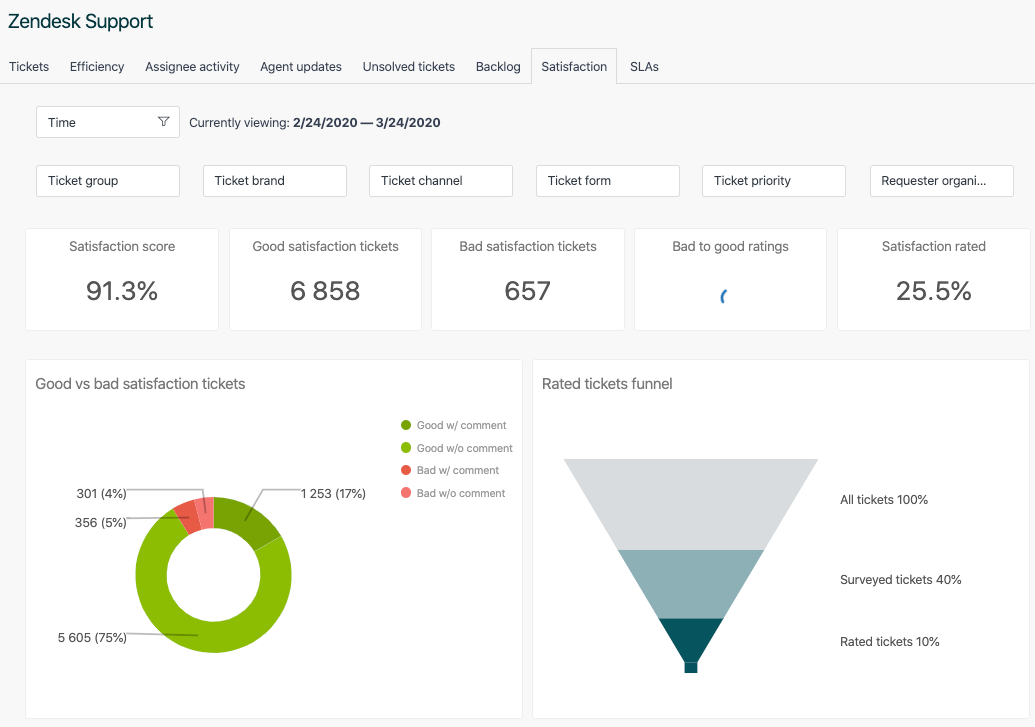
For details of all the reports on this tab, see Analyzing your Support ticket activity and agent performance.
Viewing CSAT results in a ticket
You can view the CSAT rating for an individual ticket in the ticket itself.
- In Support,
open any ticket that has received a CSAT rating,
then view the rating at the top of the ticket.
To view responses to drop-down and open-ended questions, click Events, then scroll to the relevant event.
Viewing CSAT results on the agent's dashboard (legacy)
In the legacy CSAT experience, the results of customer satisfaction surveys for agents are shown in the agent's dashboard and in a view called Rated tickets from the last 7 days.
- In Support,
click the Home (
) icon in the sidebar.
- Use Agent Home
to view:
- Ticket statistics: The number of your tickets with a Good Customer satisfaction (CSAT) rating, a Bad CSAT rating, and tickets Solved by you this week. See Sending a CSAT survey to your customers.
- Satisfaction statistics: Satisfaction statistics for you and your team, expressed as the % satisfaction attainment for the past 60 days.
The calculation of the overall satisfaction rating uses the following simple formula:
This means that the score is an average of the total positive ratings from the past 60 days. An agent with a score of 90% means that over the past 60 days, 90% of the ratings they received were positive.
The view (Rated tickets from the last 7 days) gives you a quick overview of the rating activity, with a Satisfaction column containing both Good and Bad ratings. You can clone and modify this view or create your own. This view is inactivate by default.
The following rules apply to agents when using customer satisfaction rating:
- Agents cannot rate tickets.
- All agents see their ratings in their dashboard. This feature is enabled at the account level and applies to all agents in your Zendesk account. You can't exclude individual agents from receiving ratings on the tickets they are assigned to.
Additionally, ratings cannot be moderated. All ratings are shown.
46 comments
Temiloluwa Paul Adetola
Hi Jennifer,
I have question regarding the satisfaction tab.
How can I get the individual CSAT ratings for my agents from this tab? The Tab only shows the CSAT for the entire team. Is there a way I can break this down to individual CSAT scores?
Thank you!
13
Denise von femSense
Hi!
Where can I see the actual reviews? I am especially interested in an overview of all reviews we have got over Zendesk. The only option I have found, is to manually open every ticket and see if the customer has left a review.
Is there a other way for this?
Many thanks in advance!
1
Brett Bowser
You'll need to navigate to Explore to see your overall CSAT score as mentioned in the above article.
Once you select explore int he Product Tray towards the top right of your agent interface, you can then select the Satisfaction tab which will show you the information you're looking for.
Let me know if you don't see this option on your end.
Thanks!
-3
Vitória
0
Gabriel Manlapig
Hi Vitória,
As of the moment agents (requester) cannot rate tickets in Zendesk as indicated in the article below.
About CSAT (Customer Satisfaction) ratings in Zendesk Support
I've taken a look and found that other users are discussing similar needs here.
You can up-vote that original post and add your detailed use-case to the conversation. Threads with a high level of engagement ultimately get flagged for product managers to review when they go through roadmap planning.
We truly value customer feedback and your voice and votes in the product feedback topics in the community help influence future Zendesk functionality.
0
Muhammad Umar
Hi Jennifer,
How can I get the individual CSAT ratings for my agents?
The tab only shows group data.
0
Christine
You can create a report to see individual ratings by agent. You can use this Explore recipe: Reporting on customer satisfaction by agent.
Thanks,
Christine
0
José Pedro Loureiro
I'd like to customize my satisfaction survey and add other options other than "Good" and "Bad", like "rate from 1-10". Is there any way to do this, even if I need to use an app, BUT that will reflect that in my Zendesk dashboard? I want to see how many "1" or "10" I got in this page (image attached).
Most of integrations will only display the stats in their own website. For example: if I create a survey using Typeform, I'll only be able to check the stats if I login on Typeform. What I want is to be able to check all the support stats on the Zendesk Explorer dashboard, as in the image below.
1
Christine
It is not possible to customize the satisfaction rating to 1-10 instead of good and bad. I don't see any app available in the Marketplace to achieve this as well. If you have some time, I recommend that you start a post about this in our Feedback - Ticketing System (Support) using the Product Feedback Post Template. Our Product Managers actively monitor our feedback threads, and conversations with high user engagement ultimately get flagged by the team for roadmap planning. Thank you!
0
Tomica Hleb
I'm running into an issue with tickets that get reopened after being rated, and then solved again. These tickets are then reported against a date when they were Solved for the second time instead of when being rated.
For instance:
1. Ticket gets solved by automation because the customer stops responding. The customer leaves a Bad rating.
2. We reopen a ticket to follow up, and continue working with the customer.
3. The ticket gets Solved again in February.
When we run the report, this ticket will be reported against February CSAT, although the rating was left in January. The CSAT is based on the date of Solving the ticket, not when it was rated.
Is there a way to report only on tickets that got rated in the time frame that we are running a report for instead of basing it on the Solved date?
0
Gab Guinto
You can build a custom attribute to get the timestamp of when the rating was submitted, similar to the logic in the sample here.
The sample formula above will show you the date the ticket was rated. You can use the custom date attribute to slice the CSAT data in your report.
0
Andy Hidalgo
Hi,
We would like to track the number of people who turn their bad score into a good score, as we want to measure the impact of offering the option. Is there a way to do so? Number of customers who changed there scores from bad to good (and vice versa).
Thank you
1
Jupete Manitas
In terms of tracking these CSAT update from good to bad and vice versa. There are actually metrics available that you can use to measure them and as listed here: Metrics and attributes for Zendesk Support. You can also make use of or clone the built-in report in your support and edit it according to your needs.
You can also use of the Requester attribute to filter the report under Updates history attributes.
We hope this answers your question. Thank you!
1
Andy Hidalgo
Thank you so much for your swift reply! 🤩
0
Terry Lamud
Hello,
I was hoping someone could help me, I'm trying to follow all instructions about CSAT, but still encountered error when it comes to custom formulas.
Is the [Changes - Field name] and [Changes - New value] a default value? or we need to set something for this method to work?
Thank you so much!
0
Andy Hidalgo
Hi Jupete Manitas One additional question, please! We are thinking to implement the placeholders to offer the option to change satisfaction score. However, we noticed that if an agent copies the satisfaction link in incognito window, they can rate thereselves. Is there a way to avoid this/track if it happens? This problem is holding us.
Thank you
0
Andy Hidalgo
0
Christine Diego
This is a situation that can indeed happen if the agent opens the link in a browser that doesn't have an active agent session (even if it is not in incognito). This is an expected behaviour. This has to do with how our CSAT works with token rather than login. It’s designed so Agents cannot modify the rating (if they are logged into Zendesk), but through an incognito tab this can be done.
Also, should this behavior be reversed, the behavior would then be that all users will be forced to log in to Zendesk in order to leave a satisfaction rating; our Product team has considered this design an acceptable trade-off in favor of ease of use for a broader user base (which are the end-users).
I encourage you to post this feedback in our Feedback forum.
1
Supervisor
Is there a way to see the actual CSTAT response? Not just on the Report
For example can we the admin get a copy of each response from the customer?
0
JR Lausin
You can create views to track all the tickets with satisfaction ratings with comments.
Please check this article.
https://support.zendesk.com/hc/en-us/articles/4408886290970-How-can-I-track-satisfaction-ratings-with-comments-
Sincerely,
0
Amanda Leigh
Is there a way to embed the CSAT statistic onto an external webpage to showcase it publicly?
0
David
Amanda Leigh
To embed the Customer Satisfaction (CSAT) statistic onto an external webpage using data from Zendesk, you'll primarily be interested in the Satisfaction Ratings API.
Zendesk Satisfaction Ratings API
List Satisfaction Ratings: You can retrieve a list of all satisfaction ratings for your account. This is useful for aggregating overall satisfaction scores over a certain period or for displaying recent feedback.
Endpoint:
GET /api/v2/satisfaction_ratings.json
This request will return a list of satisfaction ratings, including the score (
Good
orBad
), the comment associated with the rating, the ID of the related ticket, and the time the rating was created.Show Specific Satisfaction Rating: If you need details about a specific satisfaction rating, you can retrieve it using its ID.
Endpoint:
GET /api/v2/satisfaction_ratings/{id}.json
Replace
{id}
with the actual ID of the satisfaction rating you're interested in. This might be less relevant for displaying general statistics but could be useful for detailed analyses or specific case studies.Steps to Display CSAT Statistics on an External Webpage
Authentication: First, you need to authenticate with the Zendesk API. You can do this using basic authentication with your email and password, or preferably, using an API token or OAuth for better security.
Fetch Data: Use the Satisfaction Ratings API endpoint to fetch the CSAT data you wish to display. This typically involves making a GET request to the
GET /api/v2/satisfaction_ratings.json
endpoint to list all ratings.Process and Store Data: Process the JSON response from the API to calculate the statistics you wish to display (e.g., percentage of positive ratings). You may store this in a database or cache for efficiency.
Expose Data through Your Backend: Create a secure endpoint on your server that serves the latest CSAT statistics. Ensure this endpoint is protected against unauthorized access.
Fetch and Display Data on Your Website: On the external webpage, write JavaScript to fetch the CSAT statistics from your backend endpoint. Then, dynamically update the webpage with these statistics using HTML/CSS to match your site's design.
Regular Updates: Set up a scheduled task (cron job) to regularly update the CSAT data on your server, ensuring that the statistics displayed on your website are current.
Security and Rate Limits
That's just a general overview - you'll likely need to work with a developer to tailor that to fit your specific needs.
0
Jéssica G. Bigon
Hi
I would like to know how to use the funnel to show the percentage of surveys offered x surveys answered without using the total number of tickets.
When I try to delete this attribute, it does not allow me to calculate the percentage.
Currently, the funnel model calculates the percentage of respondents based on the total sample of tickets, which is not a correct visibility of the return rate, the ideal would be to calculate it based on the total offered.
0
Trace van der Salm
Is there already a report available for CSAT in 1-5 scale. I want to see the amount of ratings for each scale. Not only good or bad.
5
Molly Katolas
I'm also looking for reporting available for CSAT in the 1-5 scale. I need to know the count of responses for each number on the scale, not just good/bad.
4
Nick
I am also trying to figure out how to get reporting for CSAT in the 1-5 scale, not just Good/Bad. Please help
3
Benley Sy
How can I make this formula work:
0
Jennifer Rowe
Hi Molly Katolas and Nick,
To use the 1-5 scale you need to activate the updated customizable CSAT feature. (Be sure to turn off the legacy CSAT feature first, if you're using it.)
You can find information here:
https://support.zendesk.com/hc/en-us/articles/7689997846554-Sending-a-CSAT-survey-to-your-customers
Hope that helps!
-2
Nick
Jennifer Rowe - we did activate the updated customizable CSAT feature and disabled the legacy CSAT feature but I do not see where we can get reporting for the 1-5 rating scale CSAT. Please help. Also reached out to support for help but no one is getting back to me. Thanks!
2
Molly Katolas
Jennifer Rowe I have the updated customizable CSAT feature activated and functioning. I need the reporting to match. The reporting only shows good/bad - how do I get the detailed data in Explore?
6